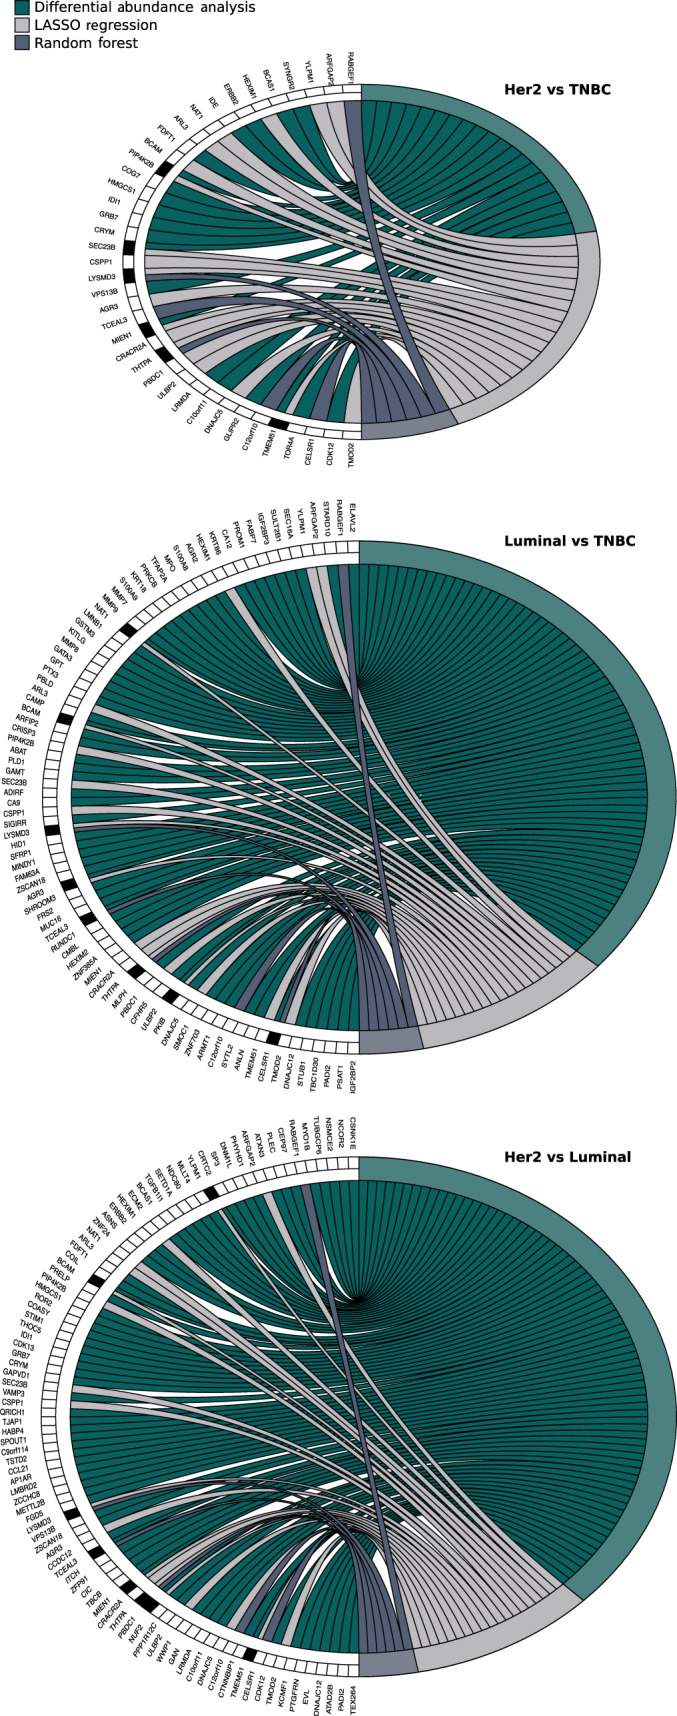
Fig. 6.

Consensus analysis of DA proteins according to BC subtype. Circle plots represent the consensus observed across DAA (green), LASSO (light gray), and RF (dark gray) analyses. Genes identified with each approach are noted on the left‐hand side of each plot. The black boxes indicate genes identified with more than one method.
