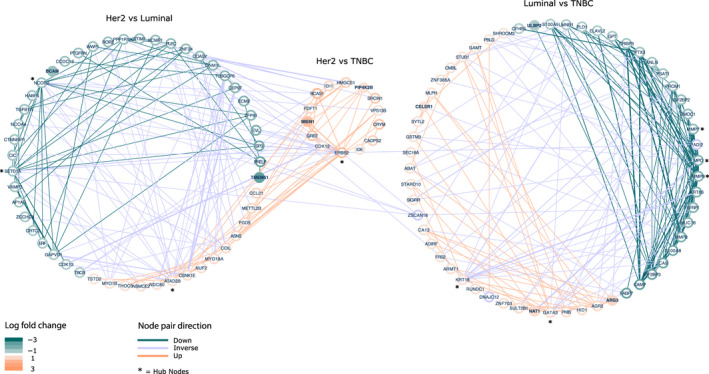
Fig. 7.

Protein‐protein interaction networks based on DA proteins from the comparison of BC subtypes (luminal, Her2, and TNBC). The plot contains three networks; (I) Her2 vs luminal, (II) Her2 vs TNBC and (III) luminal vs TNBC. Nodes (proteins) are colored according to logFC: green < −1 and orange > 1. Edges are colored based on directionality of node pair: green = both nodes down, orange = both nodes up, purple = inverse directionality of nodes. The width of edges denote the node pair interaction score (support) from STRING, and ranges from 0.25 to 1.0. Purple nodes are a part of more than one network and have opposite directionality in the networks.
