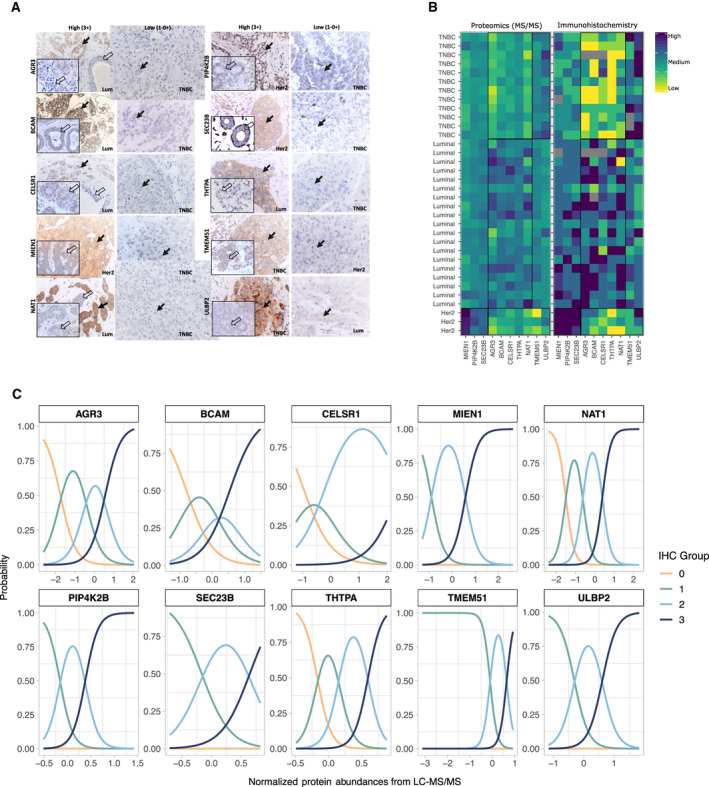
Fig. 8.

Differential intratumor and TIF abundance of 10 proteins which discriminate between BC subtypes. Intracellular expression levels of selected proteins were estimated by IHC across tumor biopsies used for TIF recovery, panel A. The expression level of each protein was considered positive if at least 10% of the tumor cells have intensities of expression scored as (0–1+), medium (2+), or high (3+), in accordance with previously described criteria (Keune et al. [85]). Representative examples of high (3+) versus low (0–1+) expression levels for AGR3, BCAM, CELSR1, MIEN1, NAT1, PIP4K2B, SEC23B, THTPA, TMEM51, and ULBP2 proteins are presented. BC subtypes are specified within each panel. Far‐normal areas of each tumor biopsy used for TIF recovery were analyzed in parallel and representative staining is shown (insertions within corresponding IHC panels). Black arrows within representative IHC images of the tumor biopsies indicate either positive (left panels) or negative (right panels) malignant cells. Transparent arrows indicate normal‐like mammary ducts located in close proximity of tumor cells. Magnification of images shown is 40×. Correlation between TIF and intracellular abundancy is summarized in panel B with tile plots containing: (a) batch‐corrected MS/MS‐based protein abundances of the top 10 candidates for discriminating breast cancer subtypes and (b) IHC scores of the same 10 proteins. Protein names are indicated on the x‐axis. Sample ID, along with assigned BC subtype, are denoted on the y‐axis. Coloring indicates low abundance/low IHC score (yellow), ranging to high abundance/high IHC score (blue). Black squares highlight which of the three subtypes the samples belonging to. Panel C contains logistic regression plots, one for each of the 10 proteins of interest, showing the probability of a given IHC score (y‐axis) in relation to normalized TIF protein abundance (x‐axis). Colors denote IHC scores of 0 (0–0.5), 1 (1–1.5), 2 (2–2.5), and 3.
