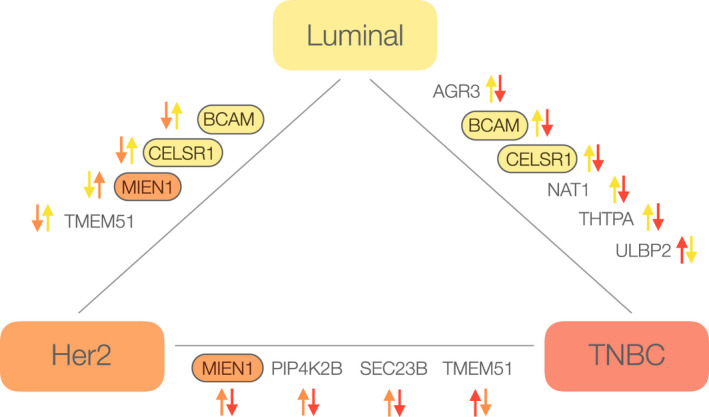
Fig. 9.

A schematic which represents the regulation pattern of 10 protein candidates in tumor and matched TIF samples according to luminal (yellow), Her2 (orange), and TNBC (red) tumor subtypes. Comparative directionality of protein abundance between subtypes is represented as arrows in corresponding colors. The proteins that are specifically upregulated in one subtype compared to the other two subtypes are marked with an oval filled with the corresponding color.
