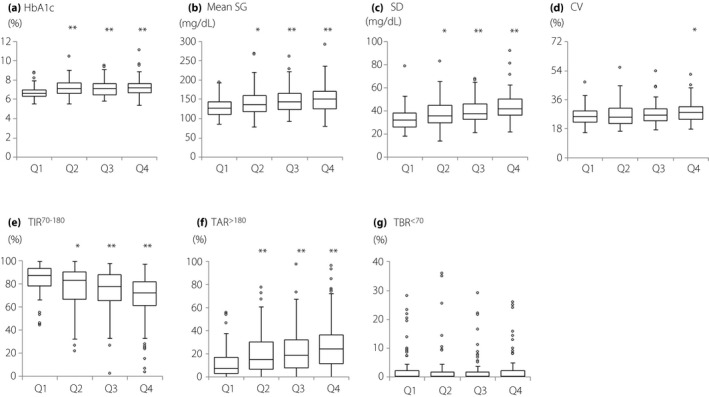
Figure 2.

Comparisons of glycated hemoglobin (HbA1c) levels and continuous glucose monitoring data among quadrants of type 2 diabetes mellitus duration. (a) HbA1c, (b) mean sensor glucose (SG), (c) standard deviation (SD), (d) coefficient of variation (CV), (e) time in range 70–180 mg/dL (TIR70–180), (f) time above range >180 mg/dL (TAR>180), (g) time above range >250 mg/dL (TAR>250) and (h) time below range <70 mg/dL (TBR<70). Data are shown in box and whisker plots using the Tukey method ○: outlier. Compared with quadrant 1 using Steel’s multiple comparison test. *P < 0.05, **P < 0.001. Q1, quadrant 1; Q2, quadrant 2; Q3, quadrant 3; Q4, quadrant 4.
