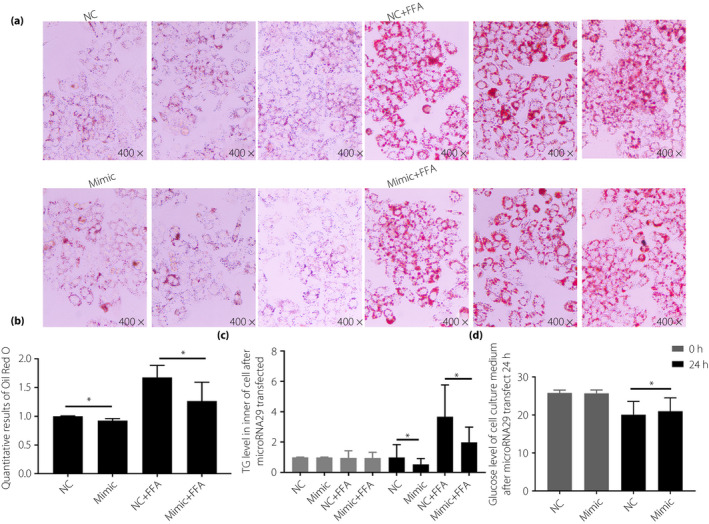
Figure 6.

HepG2 cells were transfected with the microribonucleic acid‐29 (microRNA29) mimic for 24 h, and lipid synthesis and glucose incorporation ability were subsequently detected. (a) Oil Red O staining of HepG2; (b) quantitative results of solubilization of Oil Red O stained cells with isopropanol; (c) intracellular triglyceride (TG) levels were measured; and (d) glucose concentrations cell culture medium were measured. Non‐parametric rank‐sum test was used, *P < 0.05, compared with normal weight patients (NC). FFA, free fatty acids.
