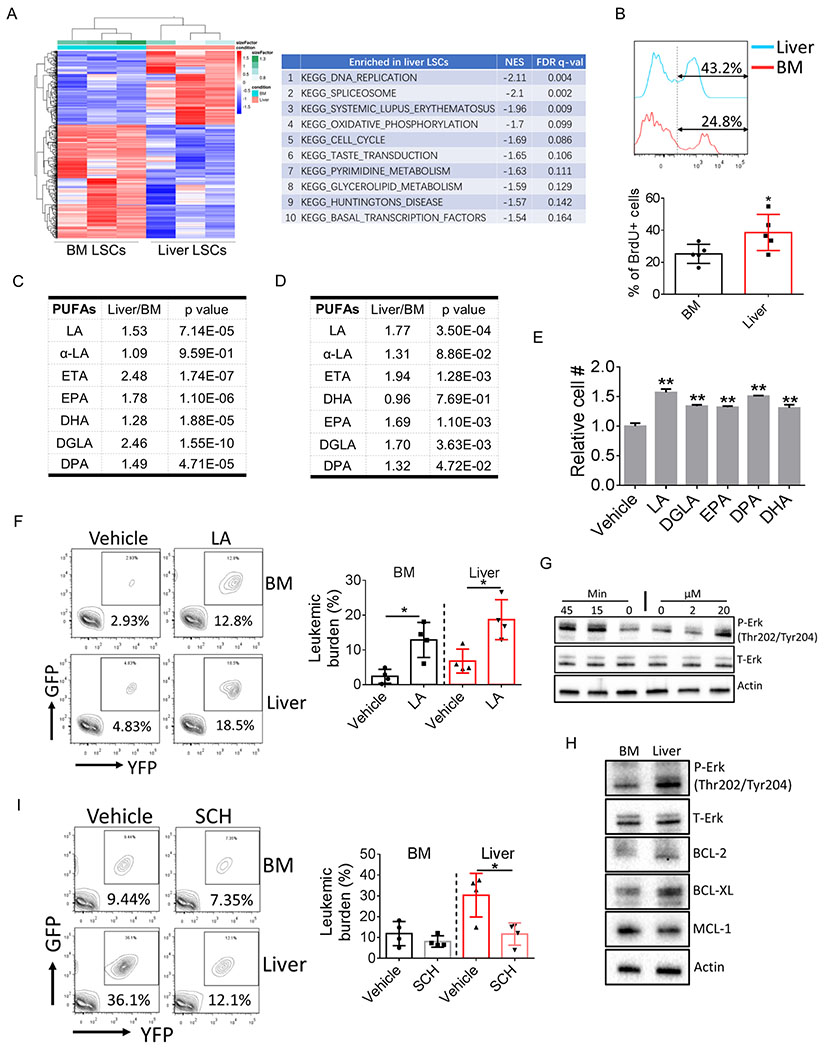
Figure 2.
Liver resident LSCs are distinct in gene signature and metabolism.
A, Heat map showing transcriptome comparison between BM and liver LSCs (left panel). Enriched signaling pathways in liver LSCs was shown on the right.
B, Leukemic mice were injected with BrdU (2 mg/kg, i.p.). Mice were sacrificed 90 min after injection and tissues were harvested to detect the incorporation of BrdU into LSCs (n=5).
C-D, Relative amount of different PUFA species in BM and liver lin− leukemia cells from bcCML model (C) (n=4) and in BM and liver c-kit+/lin− leukemic progenitors from FDN models (D) (n=7). LA: linoleic acid; ETA: Eicosatetraenoic acid; EPA: Eicosapentaenoic acid; DHA: Docosahexaenoic acid; DGLA: Dihomo-γ-linolenic acid; DPA: Docosapentaenoic acid.
E, LSCs were isolated and cultured in vitro with the presence of different PUFA species (10 μM for each PUFA). LSC cell numbers were determined after 2-day culturing. Error bars denote mean ± SD from triplicates.
F, Leukemic mice were treated with sodium linoleate starting day 2 after leukemic transplantation (200 mg/kg, i.p.). Mice were sacrificed at day 12 post leukemic transplantation and tissues were harvested to determine BM and liver leukemic burden (n=4).
G, Lin− leukemia cells were treated either with indicated doses of LA for 45 min or with LA (20 μM) for indicated time periods. Cells were harvested to determine Erk activation.
H, Lin− leukemia cells were isolated from BM and liver and the expression of indicated protein were examined by immunoblot.
I, Leukemic mice were treated with the Erk inhibitor SCH772984 (50 mg/kg, i.p.) starting day 5 after leukemic transplantation. Mice were sacrificed at day 12 post leukemic transplantation and tissues were harvested to determine BM and liver leukemic burden (n=4).
Error bars denote mean ± SD. *p<0.05, **p<0.005.

