Figure 3.
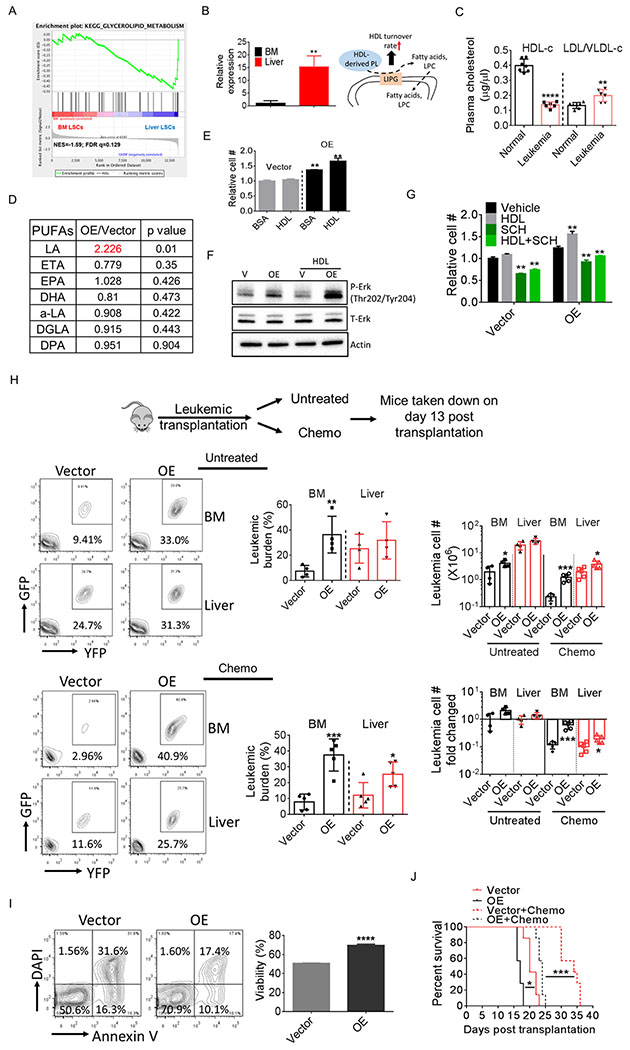
LIPG regulates PUFA metabolism and protects LSCs from chemotherapy.
A, GSEA analysis showing enrichment of the glycerolipid metabolism pathway in liver LSCs.
B, LIPG mRNA level in BM and liver LSCs. Error bars denote mean ± SD from triplicates.
C, Plasma HDL and VLDL/LDL levels in normal and leukemic mice (n=6-7).
D, Cellular amount of different PUFA species in vector-expressing and LIPG-OE lin− leukemia cells (n=4).
E, Vector-expressing and LIPG-OE lin− leukemia cells were isolated and cultured with or without the presence of HDL (100 μg/ml) for 24 h and cell number was determined. Error bars denote mean ± SD from triplicates.
F, Vector-expressing and LIPG-OE lin− leukemia cells were treated with HDL (200 μg/ml) for 30 min and cells were harvested to examine Erk activation.
G, Vector-expressing and LIPG-OE lin− leukemia cells were isolated and cultured with or without the presence of HDL (100 μg/ml) or SCH772984 (1 μM) for 24 h and cell number was determined. Error bars denote mean ± SD from triplicates.
H, Mice were transplanted with vector-expressing or LIPG-OE bulk leukemia cells (GFP+/YFP+ cells). One cohort of mice were treated with chemotherapy consisting of 5-day treatment of Ara-C (50 mg/kg, i.p.) and 3-day treatment of doxorubicin (1.5 mg/kg, i.p., first 3 days) starting day 8 after transplantation. The other cohort was untreated. Mice were sacrificed at day 13 post transplantation. Leukemic burden, leukemic cell number (per whole liver or per femur + tibia) and fold changed in BM and liver were determined (n=4-5).
I, Viability of vector-expressing and LIPG-OE bulk leukemia cells after 24 h culturing. Error bars denote mean ± SD from triplicates.
J, Survival of mice transplanted with LIPG OE or vector-expressing leukemia cells (10,000 bulk leukemia cells / mouse) treated with or without chemotherapy (same regimen shown in Fig. 3H) (n=7).
Error bars denote mean ± SD. *p<0.05 , **p<0.005, ***p<0.0005, ****p<0.00005.

