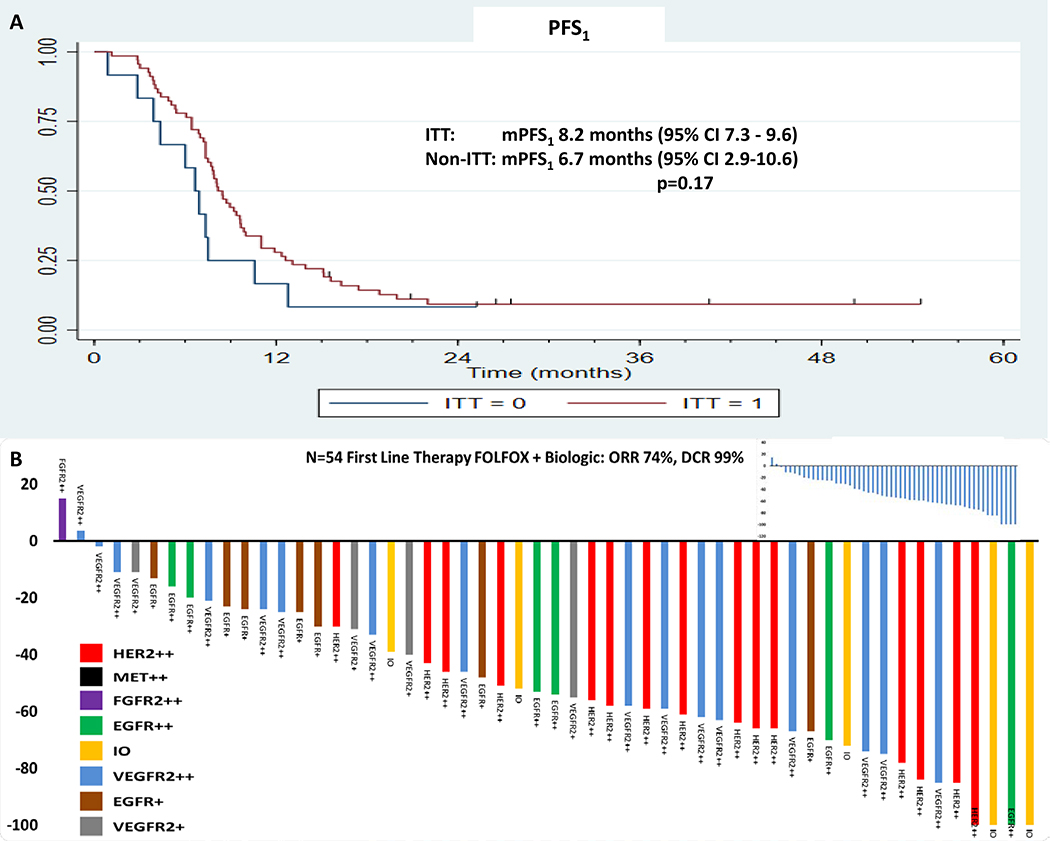
Figure 3.
A: The first-line progression free survival (PFS1) in the ITT group (red) versus the non-ITT group (blue). Figure 3B: Rainbow waterfall plot demonstrating objective response rate (ORR1, 74%) and disease control rate (DCR1, 99%) by molecular group to first-line cytotoxic therapy plus matched monoclonal antibody among patient within the ITT population having baseline measurable disease (N=54/68). Inset, waterfall plot for ORR1 ITT treated per protocol.

