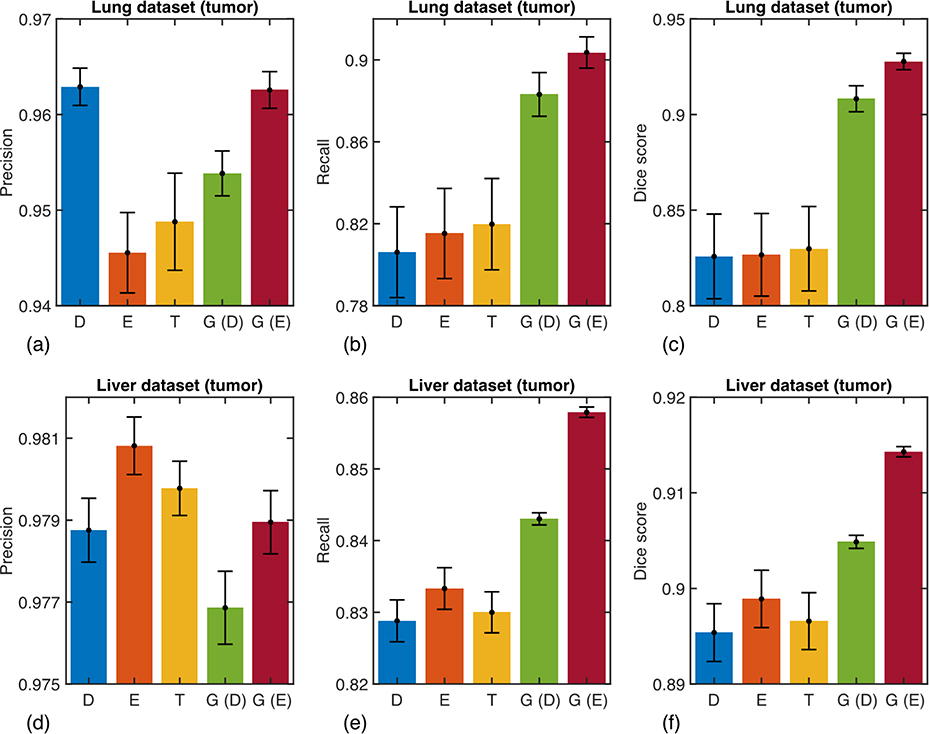
Fig. 3.
Quantitative results for the test data samples that contain at least one tumor. The averaged (a,d) precision, (b,e) recall, and (c,f) Dice coefficients are shown for the lung dataset (upper panel) and liver dataset (lower panel). D, E, T, G (D), and G (E)are results obtained with the Dice loss, Effectiveness loss, Tversky loss, generalized loss based on the deterministic approach, and generalized loss based on exploratory approach, respectively. Numerical values are reported in Supplementary Tables 2 and 4.

