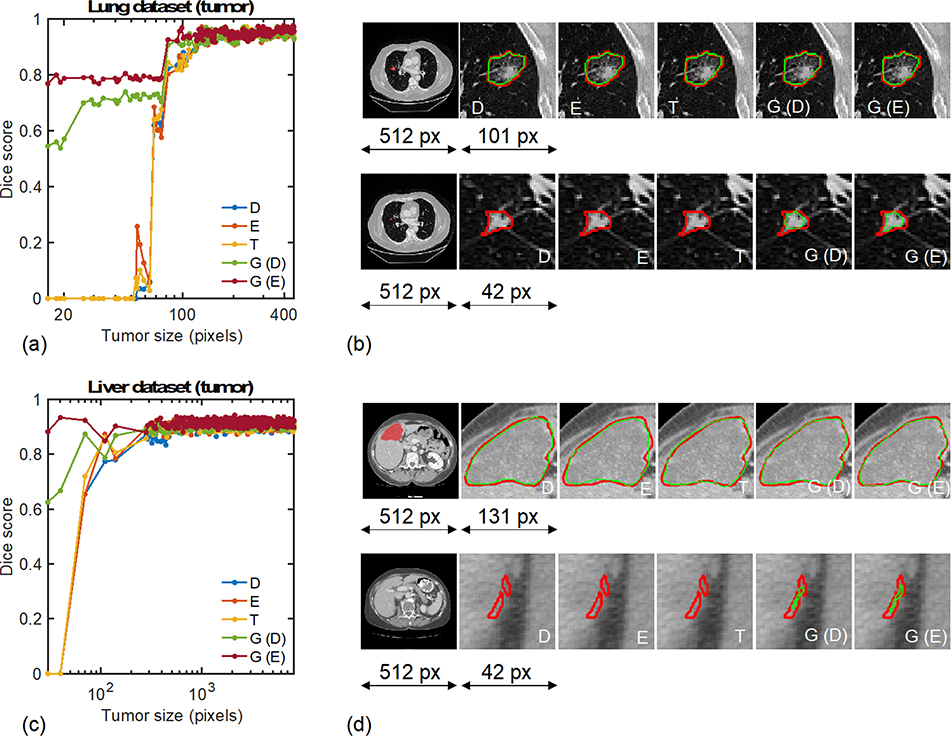
Fig. 4.
Segmentation results for the test data samples that contain at least one tumor. Distribution of Dice coefficients across tumor sizes for the (a) lung and (c) liver datasets. Visualizations of the algorithms’ delineations for the (b) lung and (d) liver datasets. In (b) and (d), the top row corresponds to an intermediate-size tumor example while the bottom row corresponds to a small tumor example. For reference for the liver dataset in (d): the full length 512 pixels of the CT scan corresponds to 30cm, the large tumor magnification window length 131px corresponds to 76mm, and the small tumor magnification window length 42 pixels corresponds to 24mm. D, E, T, G (D), and G (E) correspond to the Dice loss, Effectiveness loss, Tversky loss, generalized loss based on deterministic approach, and generalized loss based on exploratory approach, respectively.

