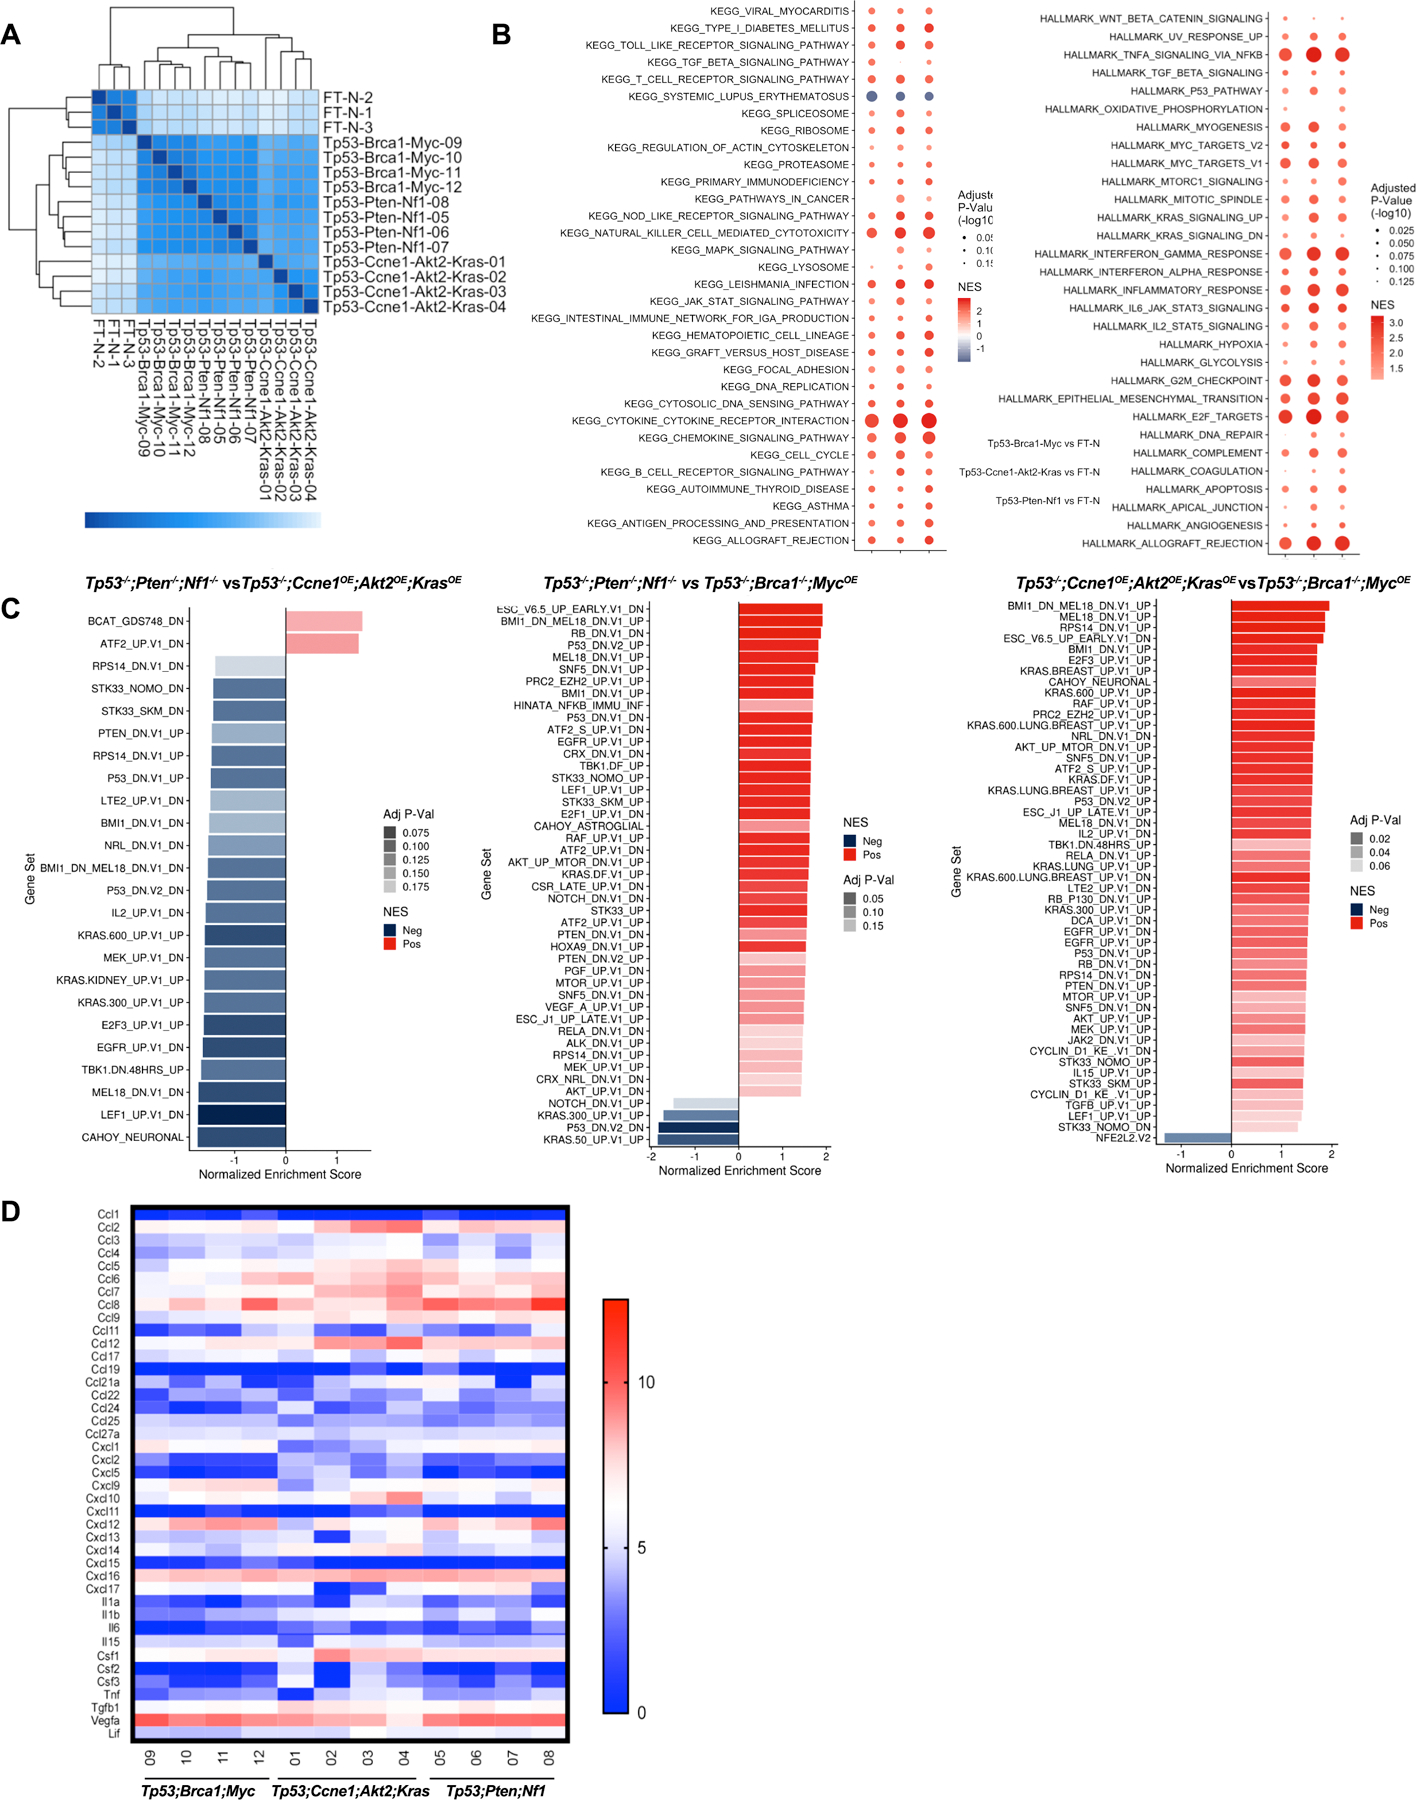
Figure 3.

Tumors derived from organoids with different genotypes have distinct transcriptomes. A,Heat map showing sample distances by hierarchical clustering, based on variance stabilized expression levels of all genes in normal FT, Tp53−/−;Ccne1OE;Akt2OE;KrasOE, Tp53−/−;Pten−/−;Nf1−/− and Tp53−/−;Brca1−/−;MycOE tumors, respectively. Shading represents Euclidian distance for each sample pair. B, Enriched KEGG (left) and MSigDB Hallmark genes (right), ranked by fold-change between the indicated groups. Shading represents the FDR-adjusted p value within each category; color indicates direction of enrichment relative to the first group of the comparison. C, Pathway analysis comparing the indicated groups. color indicates direction of enrichment relative to the first group of the comparison. D, Heat map showing transcripts (log-transformed TPMs) of the indicated chemokines/cytokines/growth factors in representative tumors from each genotype. See also Supplementary Fig. S3.
