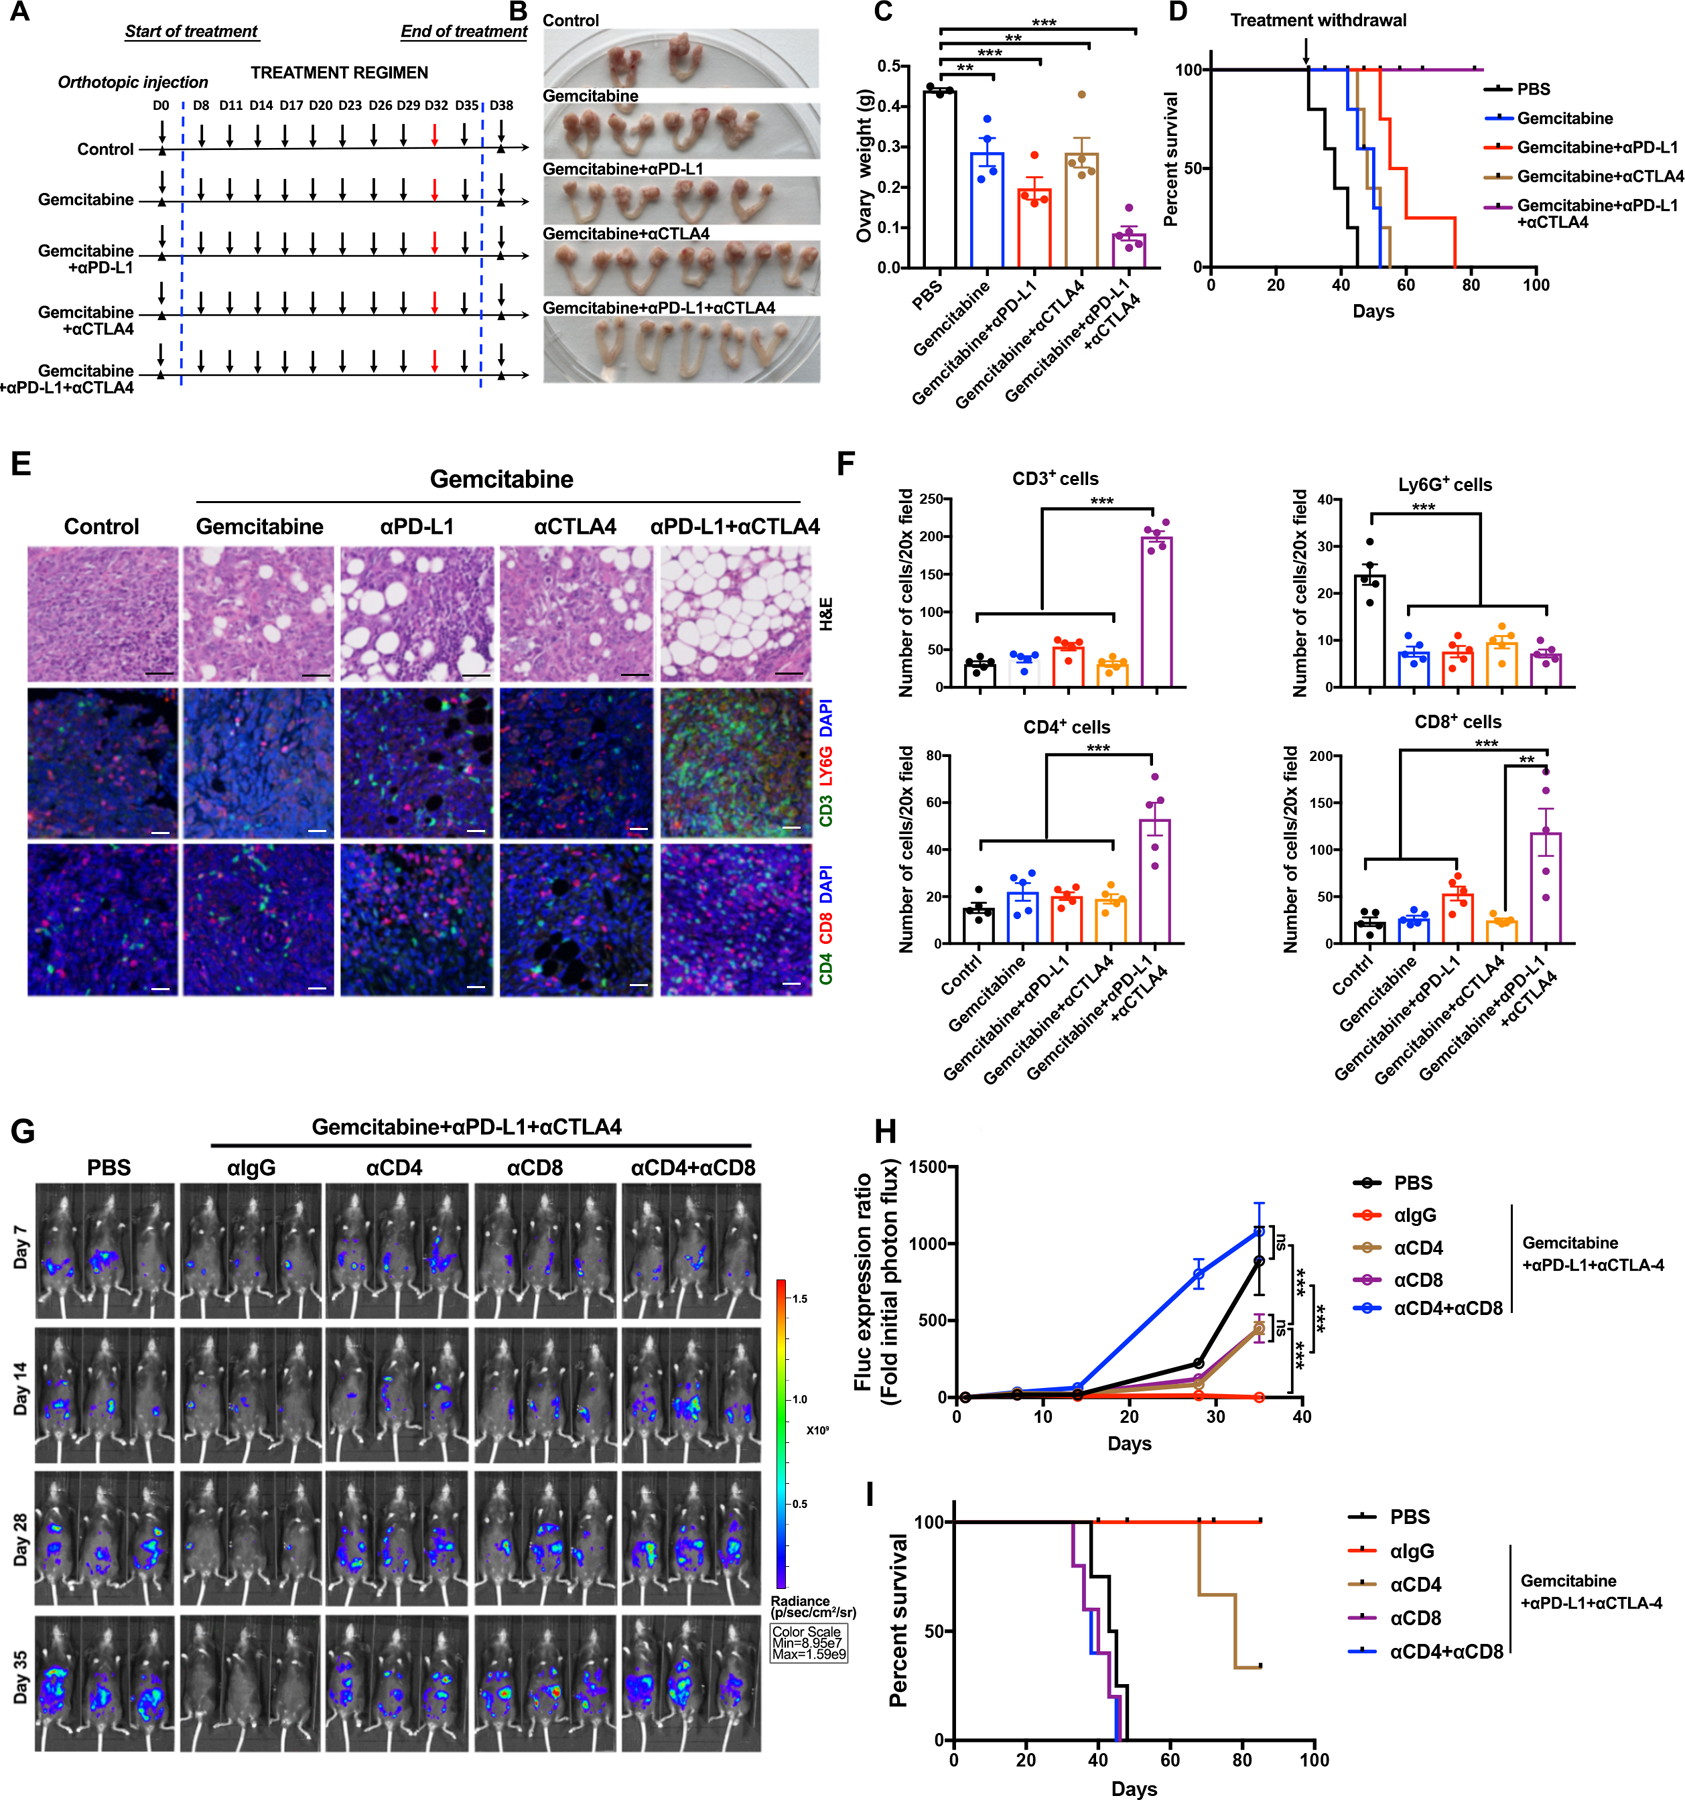
Figure 5.

Rationally derived combination regimen results in complete responses in Tp53−/−;Ccne1OE;Akt2OE;KrasOE tumors. A, Schematic depicting treatment regimens (n=10 mice/group, 2 batches). For each set of experiments, five mice were sacrificed at Day 32 for histological analysis; the other 5 were continued on treatment until Day 35, then treatment was withdrawn and mice were followed thereafter for survival. B, Representative genital tracts from Tp53−/−;Ccne1OE;Akt2OE;KrasOE tumor-bearing mice treated as indicated; mice were sacrificed at Day 32 of the scheme in (A). C, Ovary weights in mice from the indicated treatment groups. Each point represents one mouse. D, K-M curves of Tp53−/−;Ccne1OE;Akt2OE;KrasOE tumor-bearing mice, treated as indicated in A until Day35 and then monitored for recurrence, n=5 mice/group. E, H&E and IF staining for the indicated immune markers and DAPI (nuclei) in ovarian sections from the indicated groups. Note that the ovarian fat pad has almost no tumor after Gemcitabine+αPD-L1+αCTLA4 treatment. Black scale bars: 50 μm, while scale bars: 20 μm. F, Quantification of the indicated immune cells from the sections in (E). Each point represents average cell number per 20X field from 5 independent sections of each mouse. Error bars indicate SEM; **P<0.01, ***P<0.001, 2-way ANOVA. G, Representative bioluminescence images of mice bearing orthotopic tumor allografts (expressing luciferase), treated as indicated, and measured at Days 7, 14, 28, and 35, respectively. H, Relative photon flux, quantified by the intensity of bioluminescence in the regions of interest (ROIs), determined at the indicated times in mice from each treatment group, n=5 mice/group. Error bars indicate SEM; ns, not significant, ***P<0.001, 2-way ANOVA. I, K-M curves for Tp53−/−;Ccne1OE;Akt2OE;KrasOE tumor-bearing mice, treated as indicated. See also Supplementary Fig. S5 and Fig. S6.
