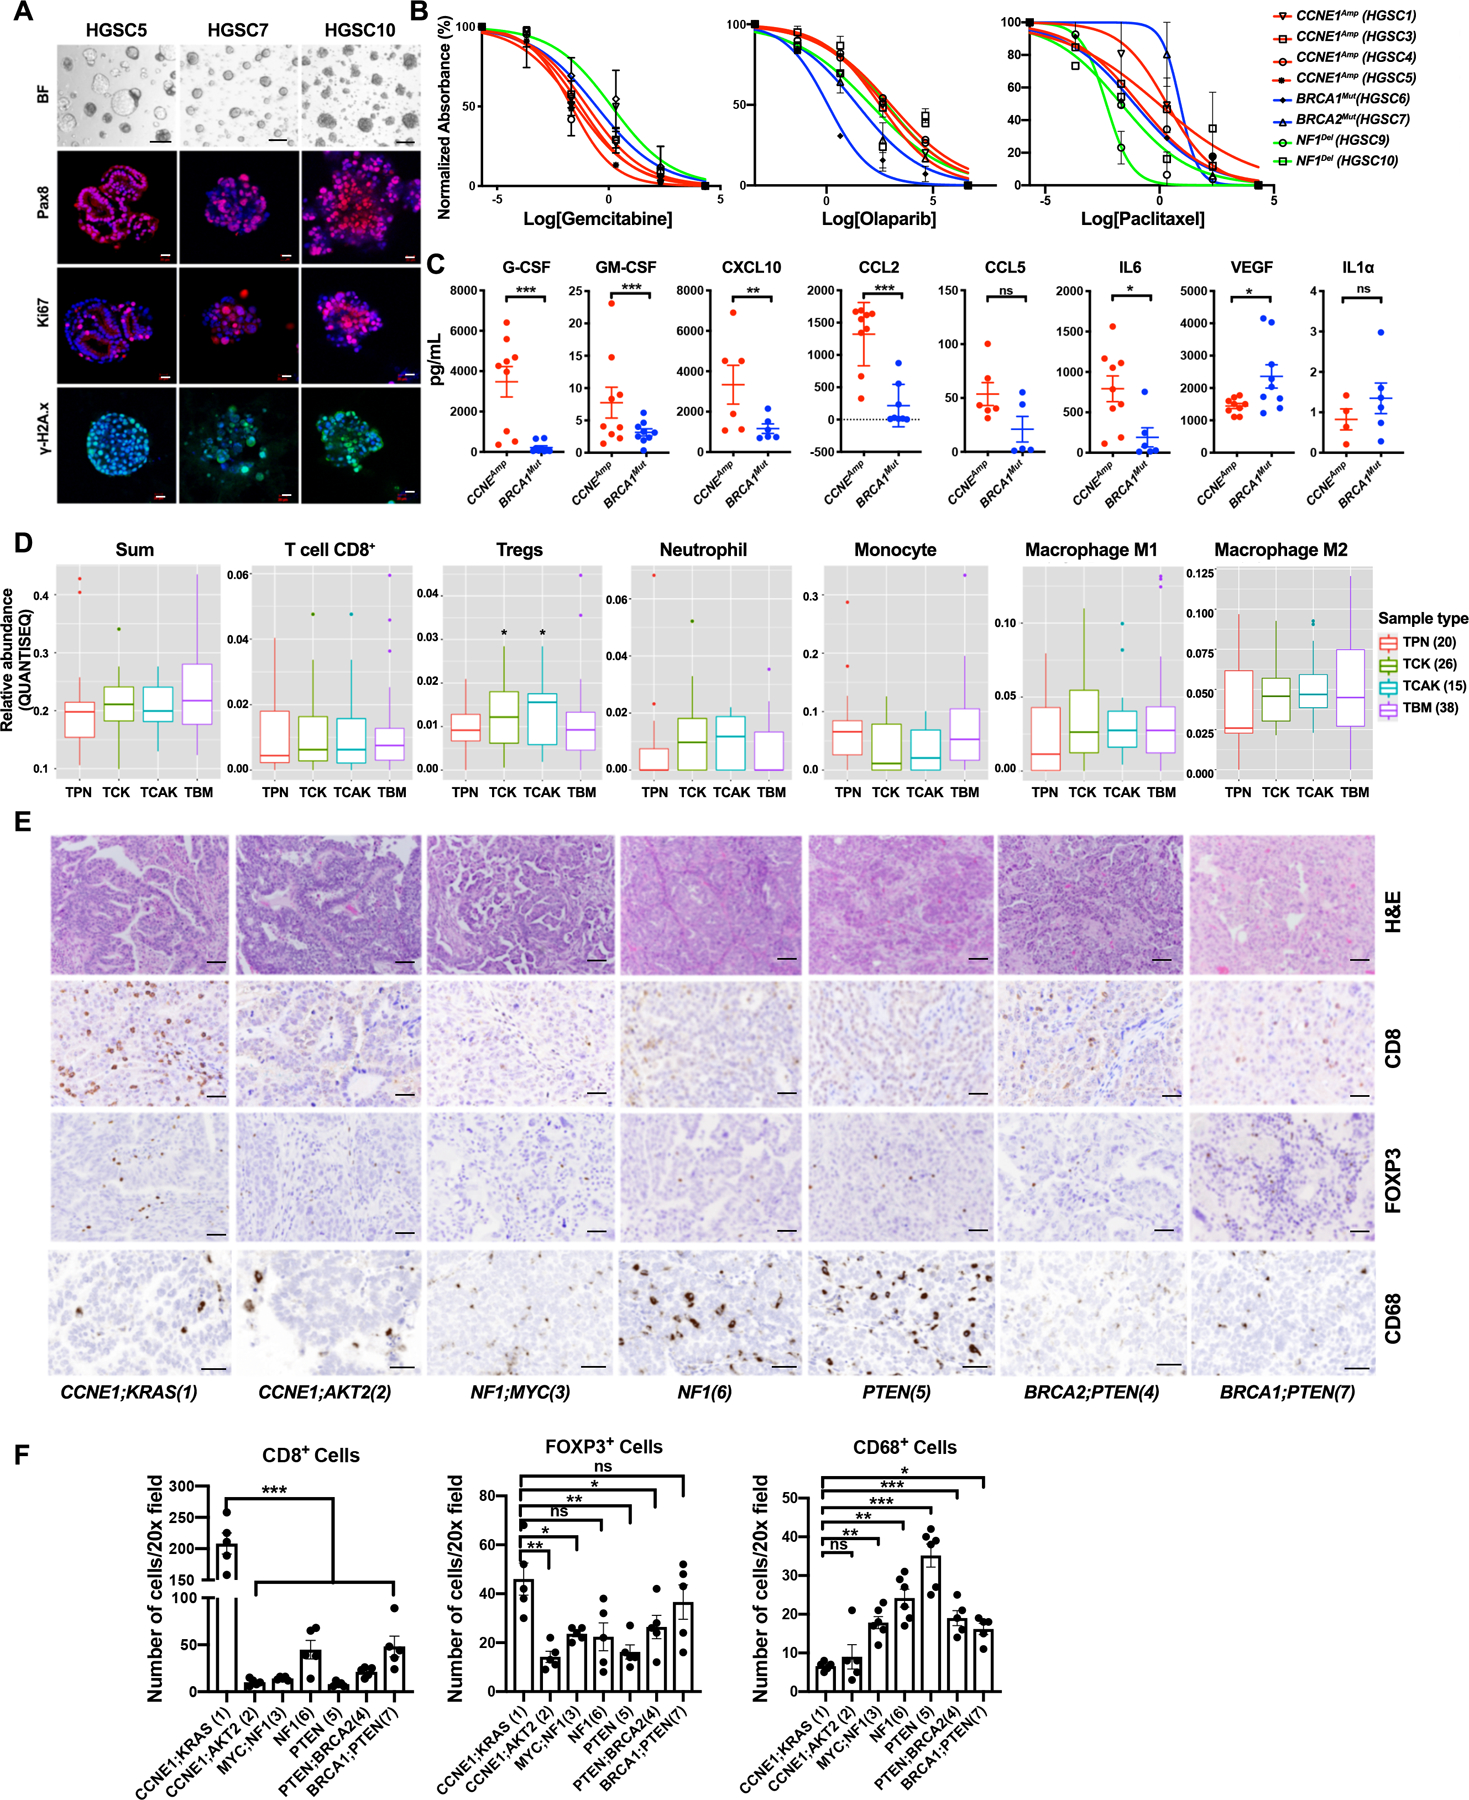
Figure 7.

Similarities between human HGSC organoids and tumors and mouse models. A, Representative bright field images and IF staining of human HSGC organoids. Scale bars: bright field, 100 μm; IF: 20 μm. B, Dose-response curves for the indicated drugs in tumorigenic organoid lines of different genotypes. Cell viability was calculated relative to 0.01% DMSO-treated control cells, measured after 5 days of treatment. C, Levels of the indicated cytokines, chemokines, and growth factors in human HGSC organoid-conditioned media; error bars indicate ± SEM **P<0.01, ***P<0.001, 2-way ANOVA. D, Relative abundance of major immune cell subtypes in human HGSC samples with indicated genotypes from TCGA, as inferred by QUANTISEQ. TPN: TP53;PTEN;NF1, TCK: TP53;CCNE1;KRAS, TCAK: TP53;CCNE1;AKT2;KRAS, TBM: TP53;BRCA1;MYC. Numbers of samples per group are shown in parentheses. *P<0.05, t-test corrected for multiple comparisons by Benjamini-Hochberg method. E, H&E-stained sections and IHC analysis of the indicated markers in representative sections from human HGSC samples of the indicated tumor genotypes. Scale bars: 100 μm. F, Quantification of CD8+ cells, FOXP3+ (Treg) cells and CD68+ cells in tumors of the indicated genotypes; average cell numbers from five 20X fields were determined. Data represent mean ± SEM, **P<0.01, ***P<0.001, 2-way ANOVA. See also Supplementary Fig. S8.
