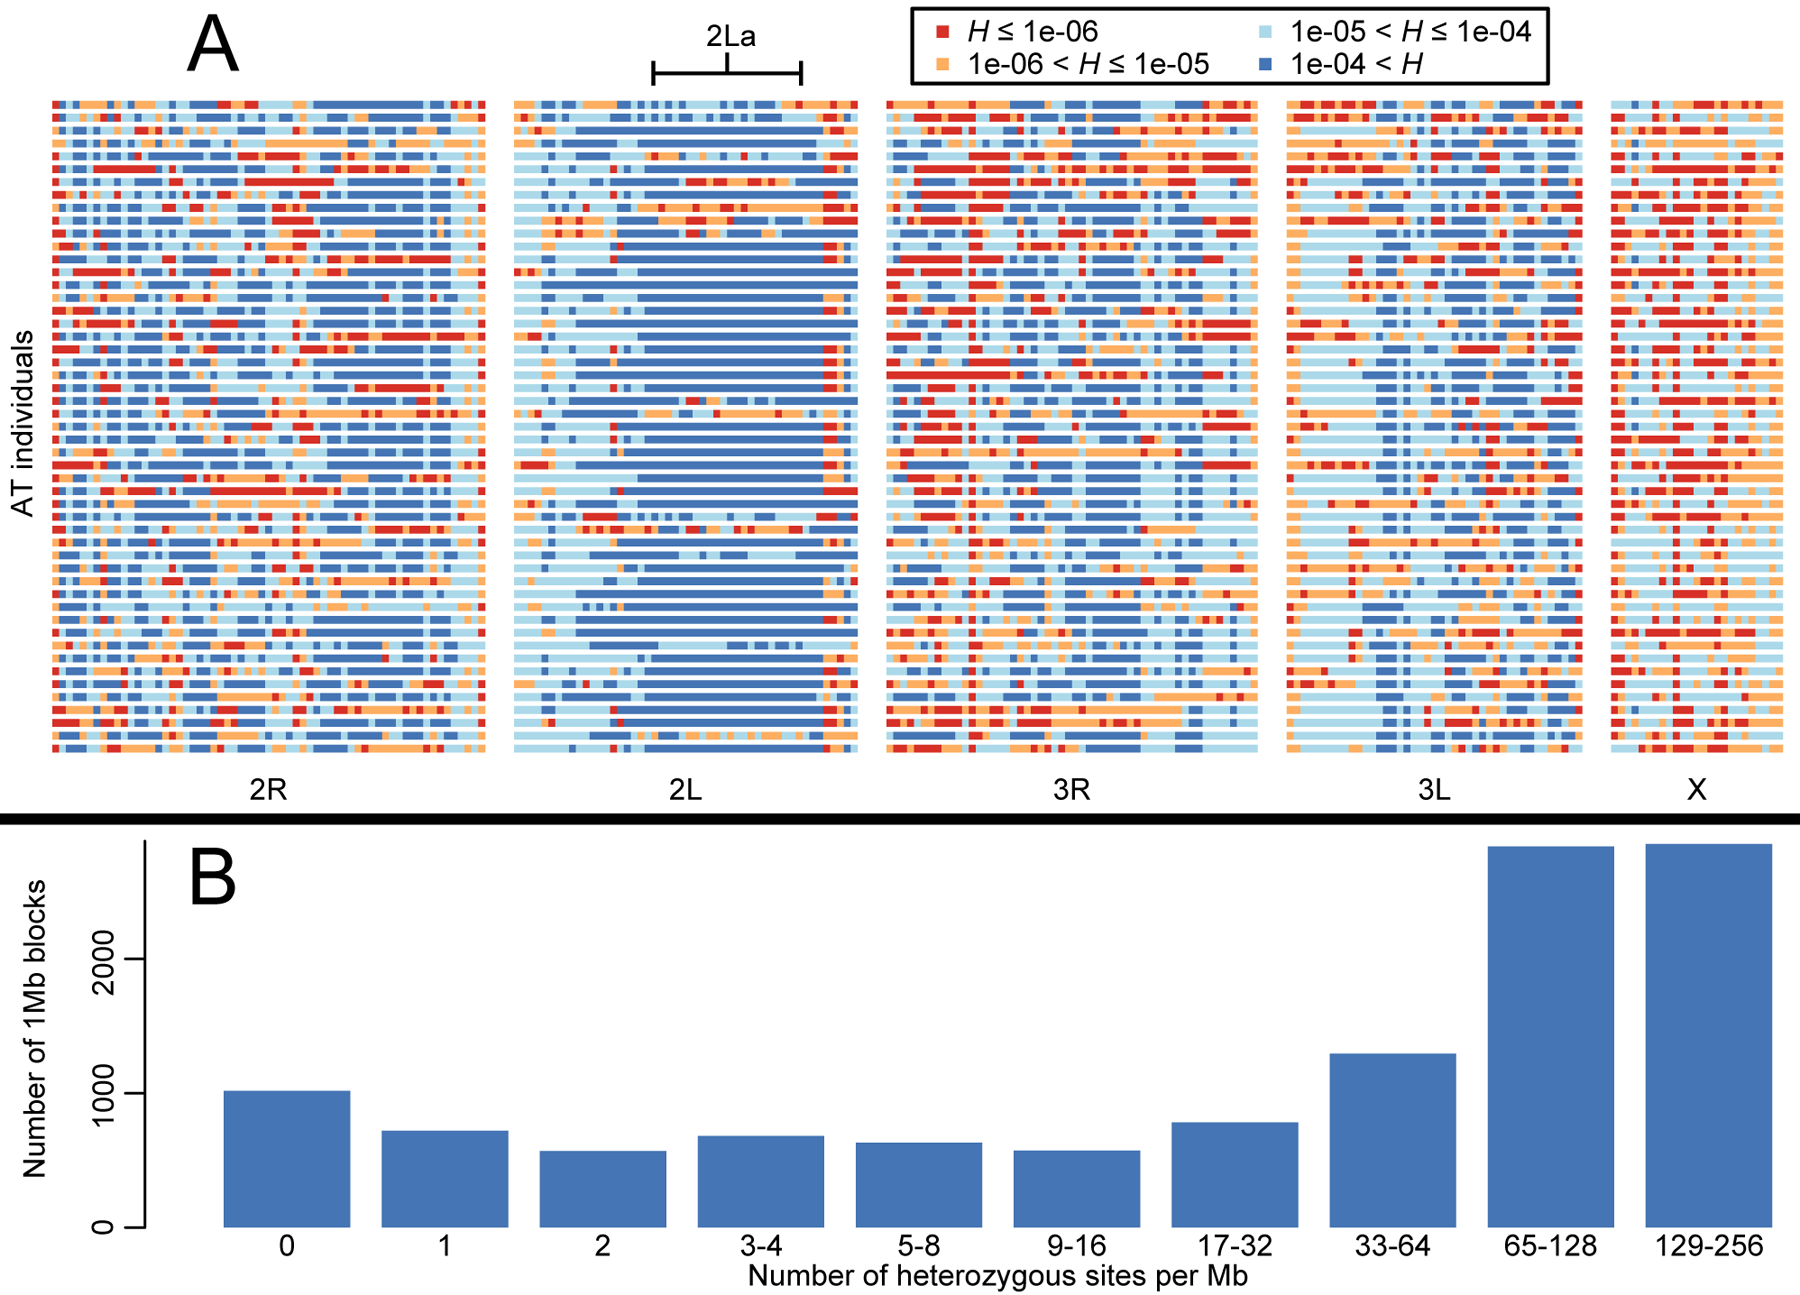
Figure 5.

Regions of low heterozygosity in AT. (A) Heterozygosity (H) in blocks of 1 Mb across the genome for all 51 AT individuals. There are many long homozygosity tracts (red) in most individuals, but these are consistent with the relatively low genetic diversity observed across the population, except in the 2La inversion. (B) Histogram of the heterozygosity blocks depicted in A, based on number of heterozygous sites. Heterozygosity shows a relatively smooth distribution with only a slight uptick for homozygous blocks (0 or 1 heterozygous sites), indicating little evidence for inbreeding driving homozygosity.
