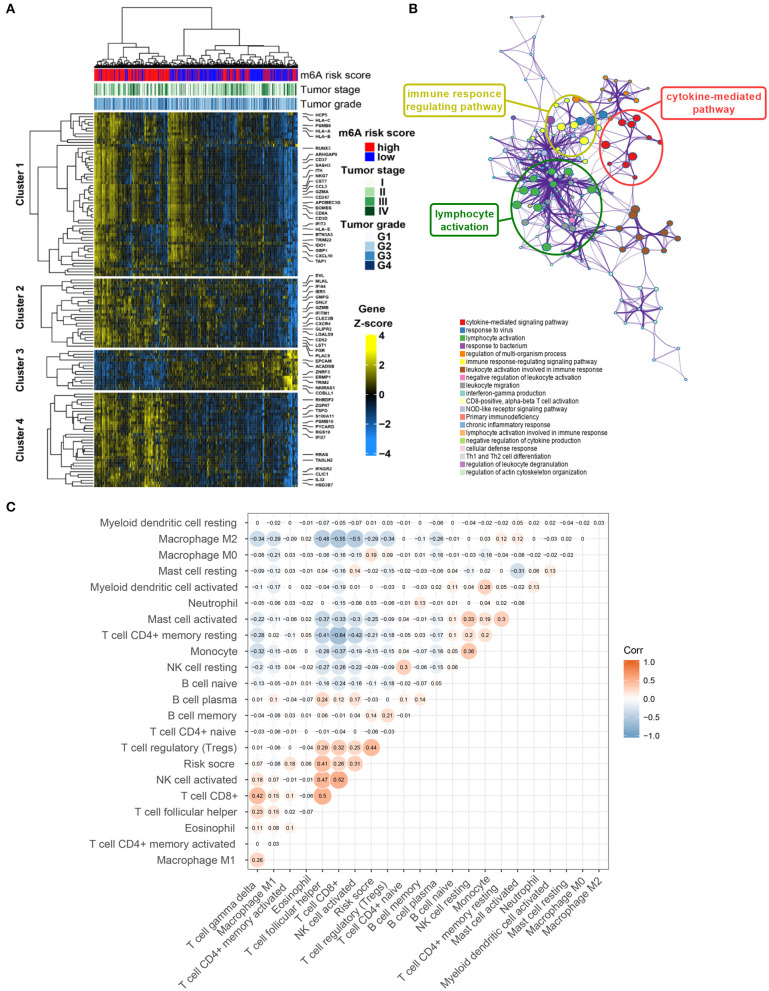
Figure 6.
Potential mechanisms of co-expressed genes associated with m6A risk score. (A) Heatmap visualizing expressions of co-expressed genes in brown module. (B) Potentially enriched pathways of co-expressed genes in brown module. (C) Correlation analysis of m6A risk score and abundance of 22 types of immune cells. m6A, N6-methyladenosine.

