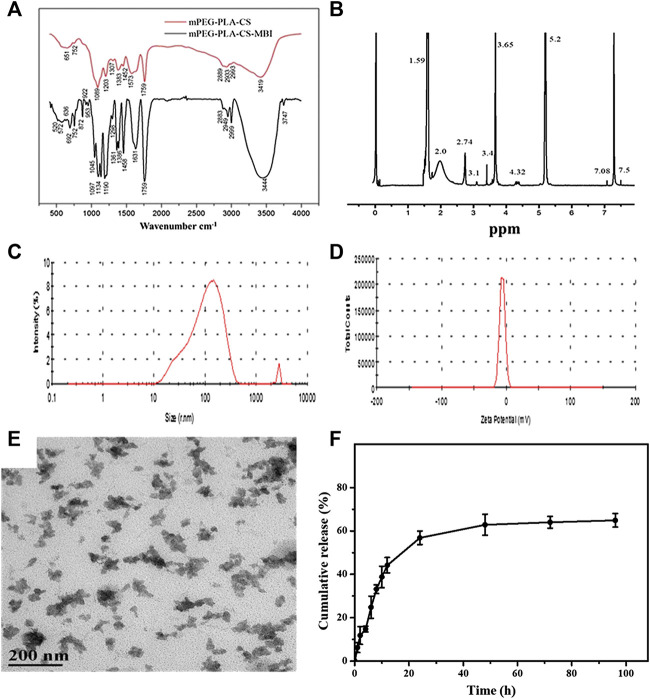
FIGURE 1.
Characterization of emodin-NP (A) FTIR spectra showing amide bands I and II of the copolymer at 1757 and 3443 cm−1, respectively (B) 1H NMR spectrum with characteristic proton peaks of PEG and PLA at 3.65 and 5.2 ppm, respectively (C) size distribution spectrum (D) zeta potential of mPEG-PLA-CS-MBI determined by laser diffraction (E) morphology of mPEG-PLA-CS-MBI nanoparticles determined by TEM (F) in vitro release of MBI from mPEG-PLA-CS-MBI in pH 7.2 PBS at 37°C.

