FIGURE 3.
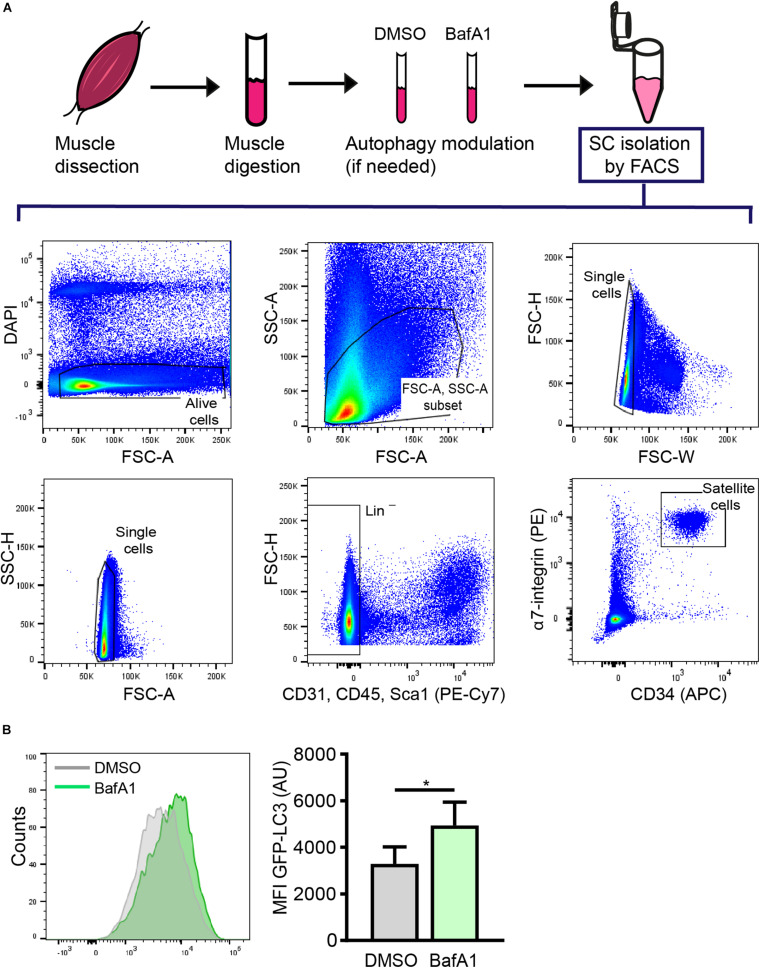
Satellite cell isolation by FACS and subsequent analysis of autophagy through flow cytometry. (A) Representative example of the FACS strategy and gating scheme to isolate quiescent SCs (QSCs) rom resting muscles. (B) Representative example of histogram of LC3-GFP intensity (left panel) and analysis of the mean fluorescence intensity (MFI) by flow cytometry (right panel) in QSCs treated for 4 h with vehicle (DMSO) or BafA1 prior to their isolation by FACS (n = 4). Mean ± SD; two-tailed unpaired t-test. *p < 0.05.

