FIGURE 5.
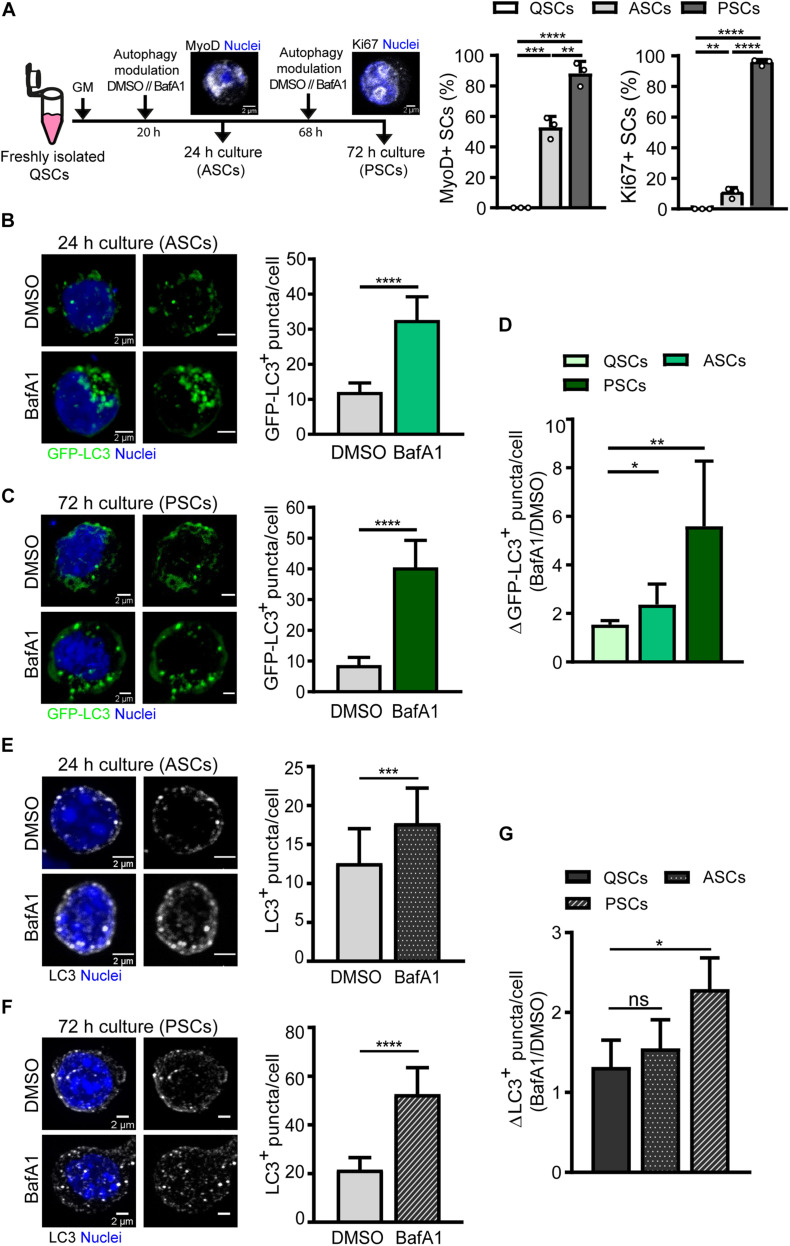
Autophagy flux analysis in activated and proliferating satellite cells by immunofluorescence. (A) Right panel: Scheme of the process followed for autophagy flux assessment in (1) activated SCs (ASCs), characterized by the presence of MyoD protein and still lacking cell-cycle proteins such as Ki67, and (2) proliferating SCs (PSCs), marked by the expression of the proliferative marker Ki67. Left panels: quantification of the percentage of MyoD+ and Ki67+ cultured SCs at 24 and 72 h time points. (B,C) Representative images of GFP+-autophagosomes (green) and nuclei (blue) in ASCs (B) and PSCs (C) from GFP-LC3 reporter mice (left panels) with the corresponding quantification of GFP-LC3+ puncta per cell (right panels). Treatment with vehicle (DMSO) or BafA1 was performed for 4 h prior fixation (n = 3). Scale bar, 2 μm. (D) Autophagy flux represented as the ratio of GFP-LC3+ puncta in BafA1 and vehicle (DMSO) along SC myogenesis in vitro (n = 3–6). (E,F) Representative images of LC3 + -autophagosomes (gray scale) and nuclei (blue) in ASCs (E) and PSCs (F) from WT mice (left panels) with the corresponding quantification of LC3+ puncta per cell (right panels). Treatment with vehicle (DMSO) or BafA1 was performed as in panels (B,C) (n = 4). Scale bar, 2 μm. (G) Autophagy flux, depicted as the ratio of LC3+ puncta in BafA1 and vehicle (DMSO), along SC myogenesis in vitro (n = 4). Means ± SD; two-tail unpaired t-test. *p < 0.05, **p < 0.01, ***p < 0.001, and ****p < 0.0001.

