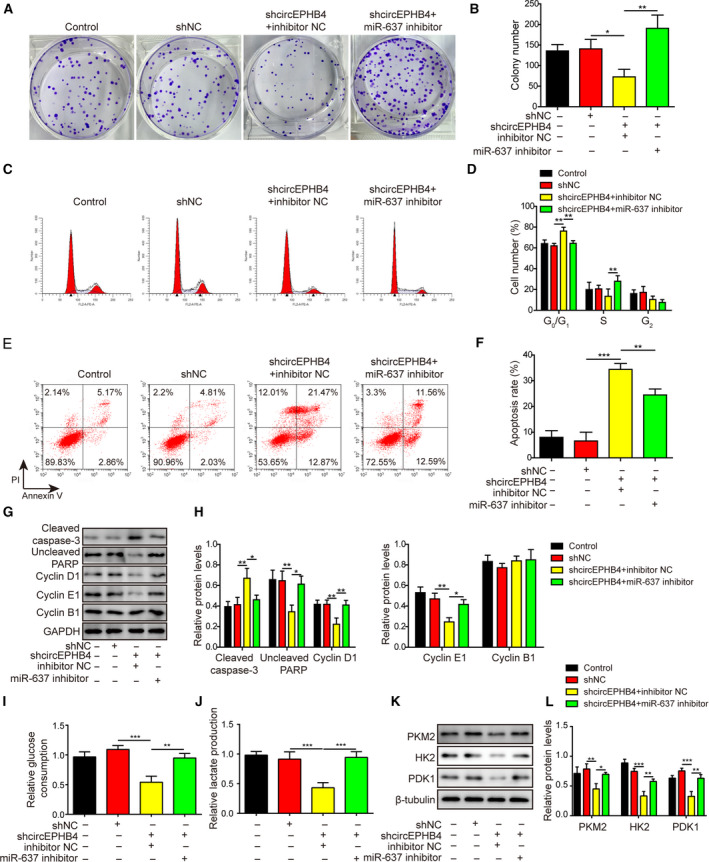
Fig. 8.

Knocking down miR‐637 reversed anti‐proliferation phenotypes conferred by shcircEPHB4. (A,B) The long‐term proliferation of indicated cells was examined by colony‐forming assay, with representative images of colonies shown in (A) and the number of colonies in (B). (C,D) The cell‐cycle distribution of indicated cells was measured by staining the cells with PI, followed by flow cytometry. Representative images were presented in (C) and the percentages of cells in different phases of cell cycle are presented in (D). (E,F) The apoptosis of indicated cells was measured by co‐staining the cells with Annexin V and PI, followed by flow cytometry. Representative images were presented in (E) and the percentage of Annexin V+ apoptotic cells in (F). (G,H) The expression levels of markers for apoptosis, cleaved caspase‐3 and uncleaved PARP, and markers for cell cycle progression, cyclin D1, cyclin E1 and cyclin B1, were examined by Western blotting (G), and quantified as the ratio to GAPDH (H). (I,J) Glucose consumption (I) and lactate production (J) from indicated cells were measured using corresponding assay kits. (K,L) The expression levels of glycolysis‐related biomarkers PKM2, HK2, and PDK1 were examined by Western blotting (K), and quantified as the ratio to β‐tubulin (L). LN229 cells were simultaneously manipulated for the levels of circEPHB4 and miR‐637 (shcircEPHB4 + miR‐637 inhibitor). Data are presented as mean ± SD from three independent experiments. Comparison between three or more groups was performed using one‐way ANOVA followed by Tukey’s post hoc test. *P < 0.05, **P < 0.01 and ***P < 0.001.
