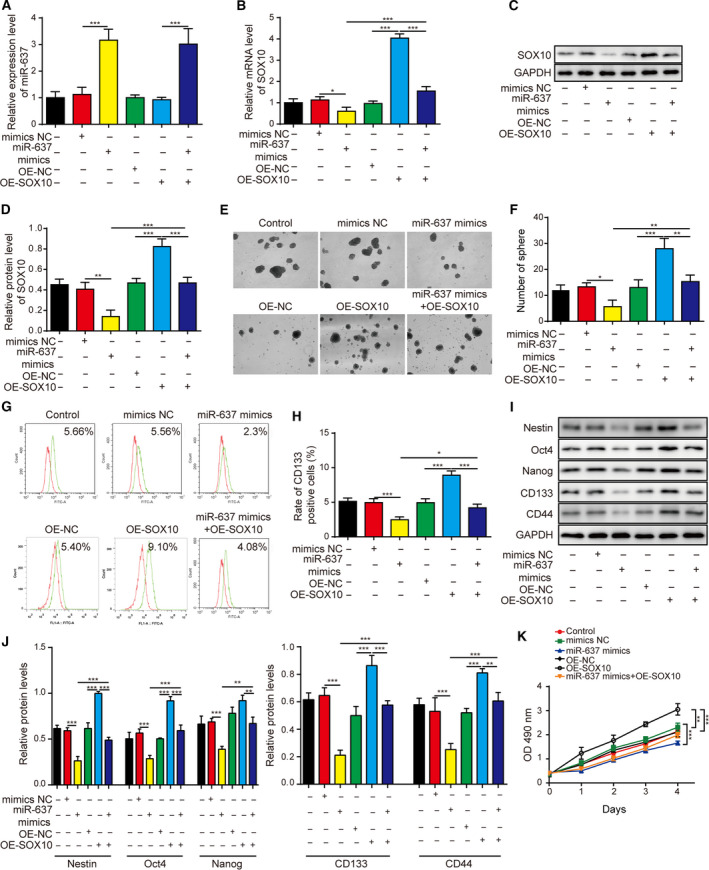
Fig. 10.

SOX10 overexpression rescued the anti‐stemness phenotypes caused by miR‐637. (A) The expression of miR‐637 was measured by qRT‐PCR in indicated LN229 cells. (B) The expression of SOX10 was measured by qRT‐PCR in indicated LN229 cells. (C,D) The expression of SOX10 was measured by Western blotting in indicated LN229 cells. (E,F) The stemness of indicated cells was examined by neurosphere formation assay, with representative images of formed neurospheres shown in (E) and the quantification results in (F). (G,H) The expression of CD133 on the surface of indicated cells was examined by flow cytometry in (G) and the quantification results are shown in (H). (I,J) The expression levels of stem‐cell markers Nestin, Oct4, Nanog, CD133 and CD44 were measured by Western blotting in indicated cells (I) and are quantified as the ratio to GAPDH (J). (K) The viability of indicated LN229 cells was measured by MTT assay for 1, 2, 3, 4 and 5 days, respectively. LN229 cells were overexpressed miR‐637 (miR‐637 mimics), SOX10 (OE‐SOX10) or both (miR‐637 mimics + OE‐SOX10). Data are presented as mean ± SD from three independent experiments. Comparison between three or more groups was performed using one‐way ANOVA followed by Tukey’s post hoc test. *P < 0.05, **P < 0.01 and ***P < 0.001.
