
Fig. 8.
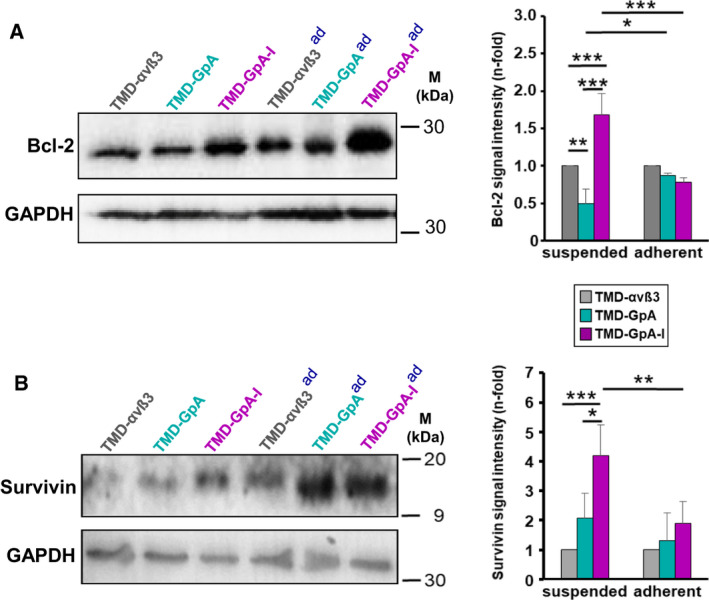
Expression of Bcl‐2 and survivin in EOC cells depending on the αvβ3‐TMD conformational activation states. Bcl‐2 (A) and survivin (B) expression was detected by western blot analysis in cells cultured in suspension or under adherence (ad) for 48 h. Representative western blots are depicted together with histograms illustrating the mean values of GAPDH‐normalized fluorescence signal intensities ± SD (n = 3) as n‐fold, by setting the values obtained for TMD‐αvβ3 transfectants under each culture condition to ‘1’. Significance was tested by two‐way ANOVA with post hoc Bonferroni t‐test. Significance is indicated by *P < 0.050, **P < 0.010, and ***P < 0.001.