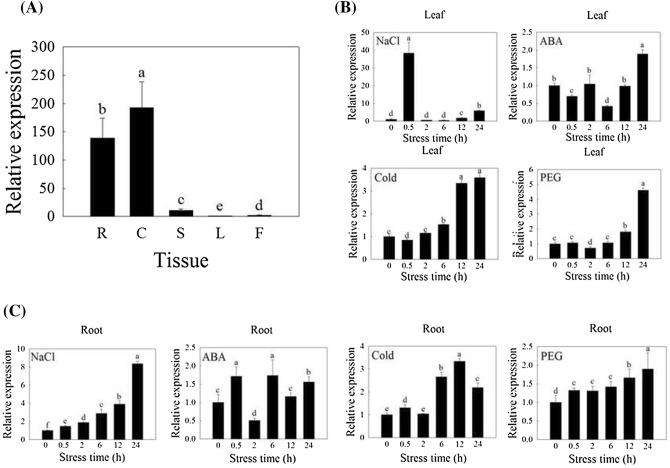
Fig. 1.
The transcription level of GmNAC06 in various organs and in response to various stresses. a The transcription level of GmNAC06 in different soybean organs was measured by qRT-PCR. b Leaf samples and c root samples under various stresses were collected at different time points to analyze the expression patterns of GmNAC06 by qRT-PCR. The values represent the averages of three independent biological experiments, and the error bars represent standard deviations. Different letters represent significant differences (P < 0.05)

