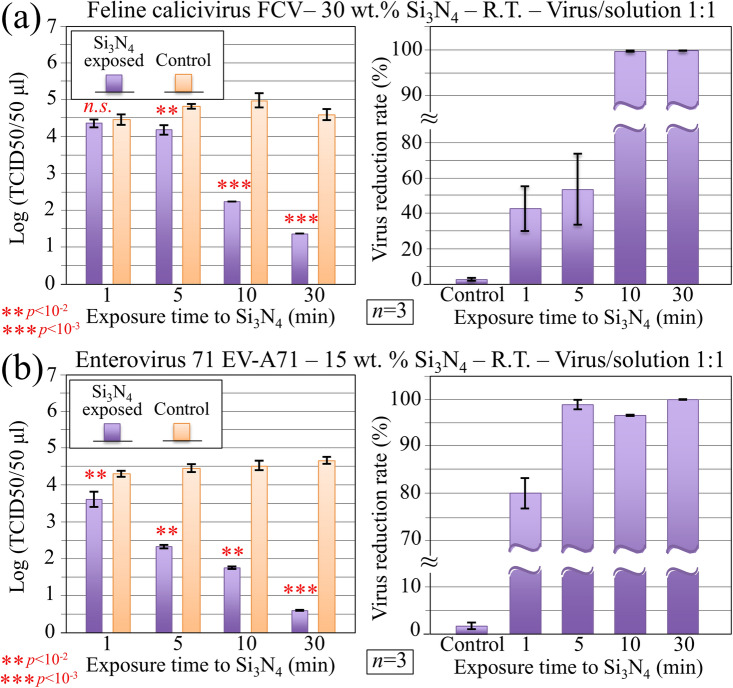
Figure 6.
Immunochemistry results collected on: (a) CRFK cells infected with FCV virus; and, (b) LLC-MK2 cells infected with EV-A71 virus. In both cases, data were collected at room temperature (R.T.) and plotted (with statistical validation) in logarithmic scale as TCID counts and virus reduction rate as a function of virus exposure time to Si3N4. The fractions of Si3N4 powder contained in the aqueous solution used in virus pre-treatment are given in inset.

