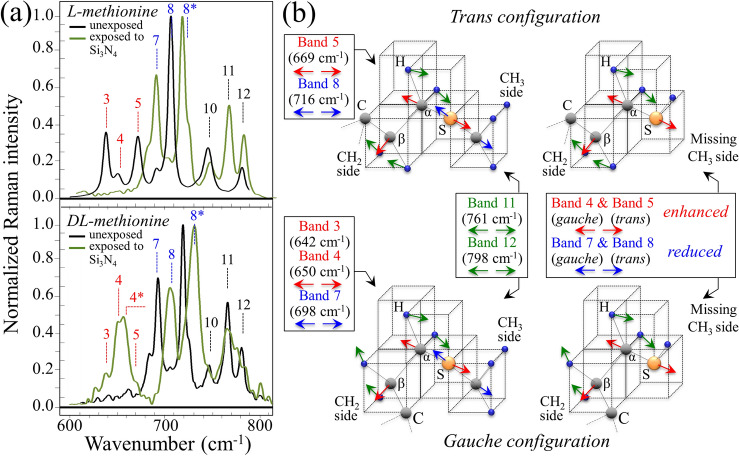
Figure 9.
(a) Raman spectra of L- and LD-methionine polymorphs in aqueous solution with and without 15 wt.% Si3N4 dispersion; spectra were collected in the frequency interval 600–800 cm−1 (vibrational modes are given by labels in inset); and, (b) schematic drafts of the trans and gauche methionine structures before and after interaction with the Si3N4 powder with a representation of the main vibrational modes (band labels in inset refer to labels in Fig. 8 and to the vibrational modes given in Table S-I).

