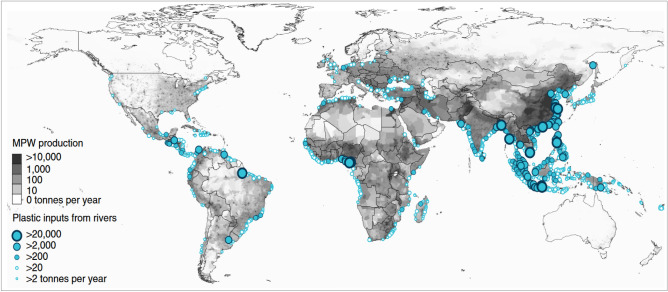
Figure 3.
Map illustrating the mass of river plastic flowing into oceans in tonnes per year29 in different parts of the world. River contributions were estimated from individual watershed characteristics such as population density (in inhabitants per km−2), mismanaged plastic waste (MPW) production per country (in kg inhab−1 day−1) and monthly averaged run off (in mm day−1). The model29 is calibrated against river plastic concentration measurements from Europe, Asia, North and South America.

