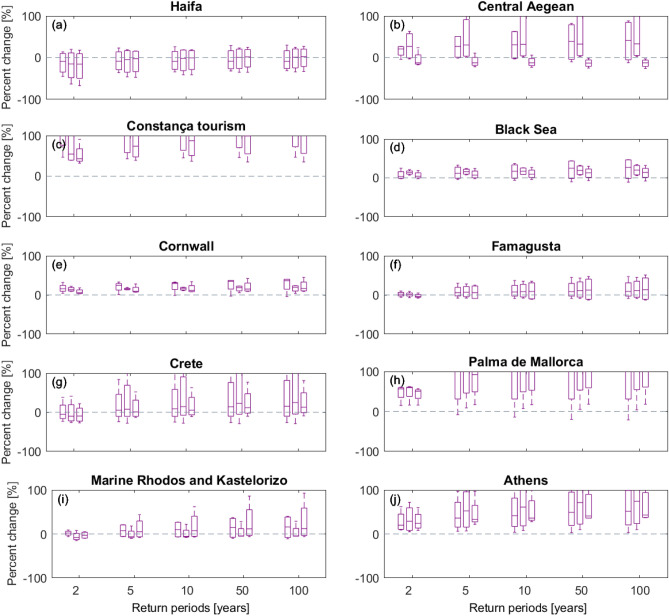
Figure 8.
Bar graphs of relative change (%) in simulated annual flood frequency magnitudes for different return periods for three catchments for each selected incident sites. Relative change is estimated as the percent difference between indices estimated for a current climate period 1971–2000 and those for a 30-year period centered on 2080 following emission scenario RCP8.5. Axes are cut at 100% change to improve readability. Flood magnitude is predicted to increase in Athens, Palma de Maiorca and the Aegean Sea as a whole (including Crete) until 2018, and similarly so for Constança. Minor increases are estimated for Rhodos and Kastelorizo, together with Famagusta in Cyprus and Cornwall (UK). Estimates for the Black Sea differ from those for Constança, indicating only a slight increase in flood magnitudes for all return periods.

