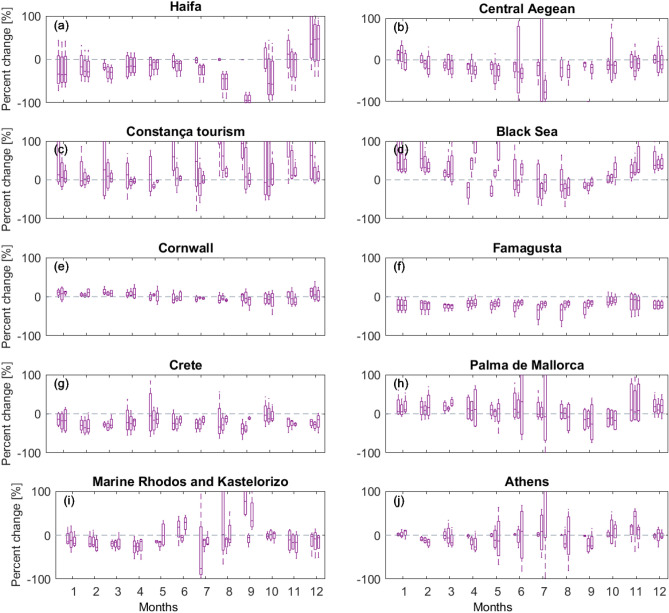
Figure 9.
Bar graphs of relative change (%) in simulated mean monthly flow for different return periods for three catchments for each selected incident sites. Relative change is estimated as the percent difference between indices estimated for a current climate period 1971–2000 and those for a 30-year period centered on 2080 following emission scenario RCP8.5. Axes are cut at 100% change to improve readability. Monthly catchment flows are expected to decrease in Famagusta, Crete, Rhodos and Kastelorizo, with variations recorded amongst this locations. The Central Aegean is predicted to record drier summers but slightly wetter winters. The Black Sea and Constança will record increases in monthly catchment flow, likely in association with the capture of thawing water and river flow from surrounding mountains.

