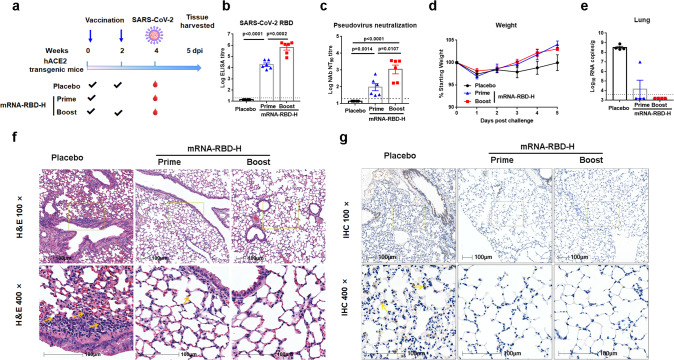
Fig. 3. Protection efficacy of mRNA-RBD in hACE2 transgenic mice against SARS-CoV-2.
a-d Groups of hACE2 transgenic mice (n = 6) received one (prime group) or two (boost group) doses of mRNA-RBD-H or placebo via the i.m. route. Four weeks post initial vaccination, mice were challenged with 1 × 10⁵ FFU of SARS-CoV-2 virus. a Mice immunization and challenge schedule. The blue arrows indicate the time of vaccination. b, c Sera collected at 4 weeks post initial vaccination were examined for IgG (b) and neutralizing antibody (c) titers. d Mice weight change after challenge. e Virus titers in lungs of challenged mice (n = 4). f Representative histopathology (H&E) of lungs in SARS-CoV-2-infected hACE2 mice (5 dpi). Infiltration of lymphocytes within alveolar spaces is indicated by yellow arrows. Scale bar, 100 μm. g Representative immunohistochemistry (IHC) of lung tissues with SARS-CoV-2 N-specific monoclonal antibodies. Virus is indicated by yellow arrows. Scale bar, 100 μm. mRNA-RBD-H indicates the high-dose vaccine (15 μg). Data are means ± SEM (standard error of the mean). Comparisons were performed by Student’s t-test (unpaired, two tailed). Placebo animals = black circles; one injection-animals = blue triangles; two injections-vaccinated animals = red squares; dotted line = the limit of detection. Data are one representative result of two independent experiments. Source data are provided as a Source Data file.

