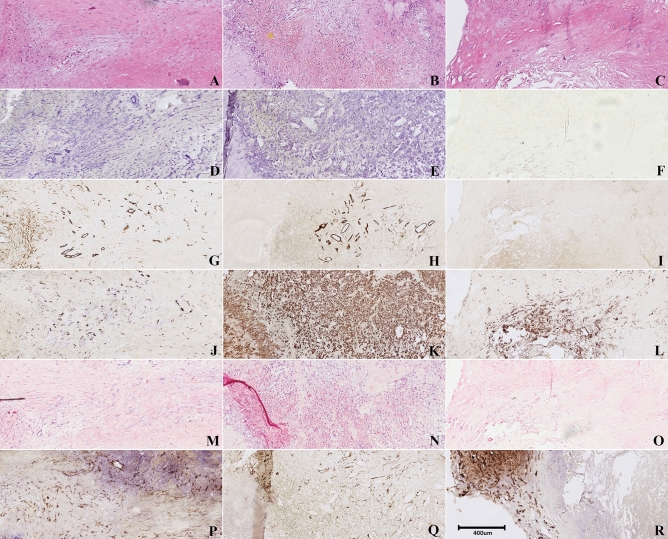
Figure 3.
Representative examples of histologic parameters of hot spots of a culprit, the asymptomatic and a non-culprit plaque. The stainings were performed on subsequent slides, depicting a ROI in the specimens. (A–C) H&E stain, demonstrating extensive intraplaque hemorrhage in the culprit plaque (the yellow asterisks indicate areas with red blood cells, orange spots); (D–F) VEGF-A stain, revealing elevated VEGF-A expression quantified by the H-score in both the culprit and asymptomatic plaque as opposed to the non-culprit plaque; (G–I) CD34 stain indicating the association between VEGF-A and microvessel density; (J–L) CD68 stain, demonstrating an influx of macrophages around the micro vessels in the culprit and asymptomatic plaque; (M–O) Von Kossa stain, revealing no differences between the culprit, asymptomatic and non-culprit plaques; (P–R) SMA stain, showing elevated SMA expression in the non-culprit plaque.

