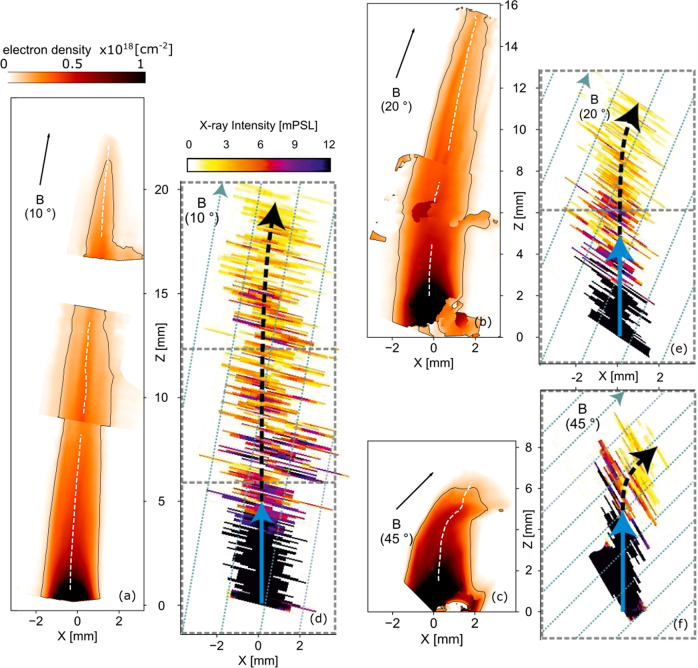
Fig. 2. Laboratory plasma expansion observed in misaligned configurations.
a Laboratory electron density integrated along the probe line of sight, in a 20 T case at 36 ns, retrieved via interferometric measurement (see ”Methods” section), with a misalignment of α = 10 degrees between the target and the magnetic field. The target normal is along z (as illustrated by the dashed gray arrows in Fig. 1A). b Same as a, with α = 20 degrees. c Same as a and b with α = 45 degrees, and at 16 ns after the laser interaction. d, e, f Same as a, b, c regarding the magnetic field angles, but as measured by X-ray spectroscopy inferred from He line emission (transition He 4p–1s on the Fluorine ion); the X-ray measurements are integrated in time (see “Methods” section and Supplementary Note 2). In a, b, c, the white dashed line follows the center of mass, measured from these electron density maps, assuming a constant ionization state at a given distance from the target (the lines are interrupted when the density map is noisy or when transiting from a frame to another, in order to reconstruct the full jets—see “Methods” section); the contour follows the 1 × 1017cm−2 integrated density value; the black arrows indicate the initial magnetic field direction. In d, e, f, the images are the result of a combination of different frames (shown by the dotted rectangles), in order to reconstruct the full jets (see “Methods” section); the dashed blue lines indicate the magnetic field direction; the solid blue and dashed black arrows are here to guide the eyes on the bending of the 2D X-rays pattern. In all cases, z = 0 represents the target surface.

