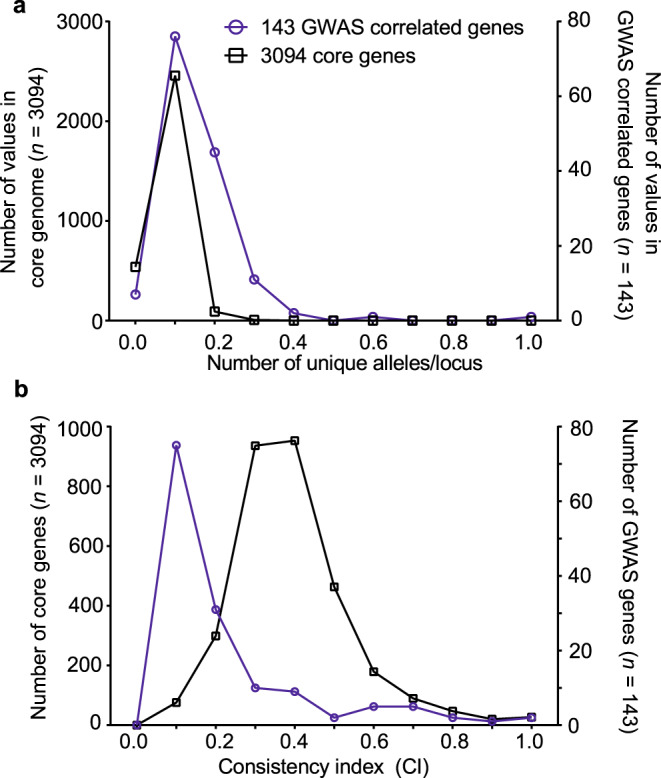
Fig. 4. Comparison of allelic variation and consistency index for core genes and genes containing disease-associated elements.

a The average number of alleles per locus and b consistency indices to a core phylogeny, were calculated for each gene alignment for core genes and 143 genes containing pathogenicity-associated elements using R and the phangorn package. The left y-axis indicates the number of core genes (black line), the right y-axis indicates the number of genes containing pathogenicity-associated elements (blue line). For the consistency index, the two distributions were significantly different (two-tailed Mann–Whitney test; p-value = 0.0001, Mann–Whitney U = 11,366). Source data are provided as a Source Data file.
