
FIGURE 5.
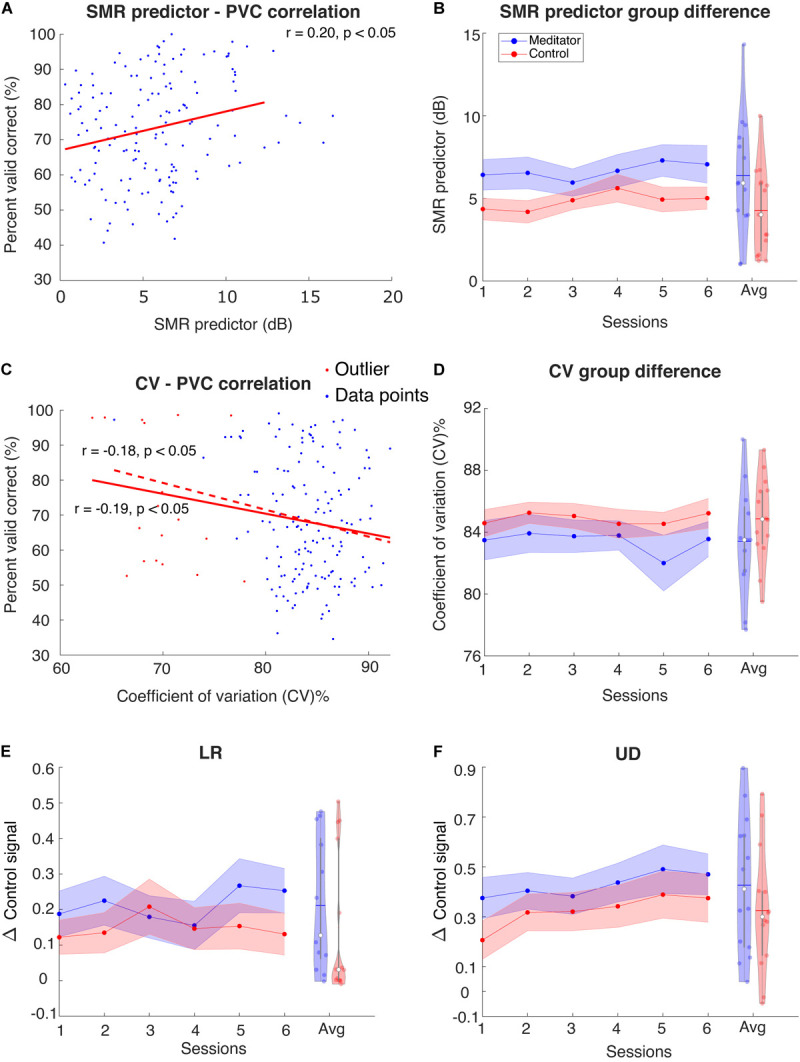
(A) Regression between SMR predictor and PVC for UD task. Red line is regression line. For LR the correlation is not significant (plot not shown). (B) Group averaged SMR predictor for the meditator group and control group. Violin plot shows the session-averaged result. (C) Regression between resting-state stability and PVC for LR task. For UD task the correlation is only significant before excluding outliers (plot not shown) (D) Group averaged stability for the meditator group and control group. Violin plot shows the session-averaged result. (E,F) Group averaged Δ control signal for (E) LR and (F) UD. Violin plot shows the session-averaged result.