Figure 1.
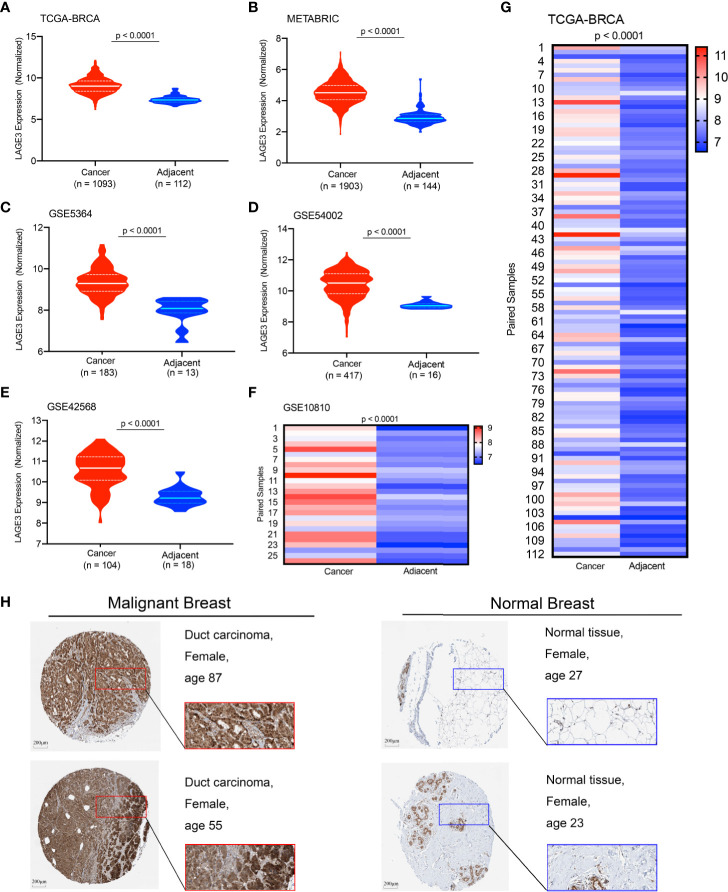
Expression profile of LAGE3 in malignant and normal breast tissues. The LAGE3 transcript levels in BC and adjacent normal breast tissues from the (A) TCGA-BRCA cohort; (B) METABRIC dataset; (C) GSE5364; (D) GSE54002; and (E) GSE42568 are presented as violin plots. (F, G) The heatmap was showing LAGE3 mRNA expression in matched BC and corresponding adjacent normal breast tissues in GSE10810 and TCGA cohorts. (H) Representative immunohistochemistry images and detailed information of LAGE3 in malignant and normal breast tissues were obtained from The Human Protein Atlas database.

