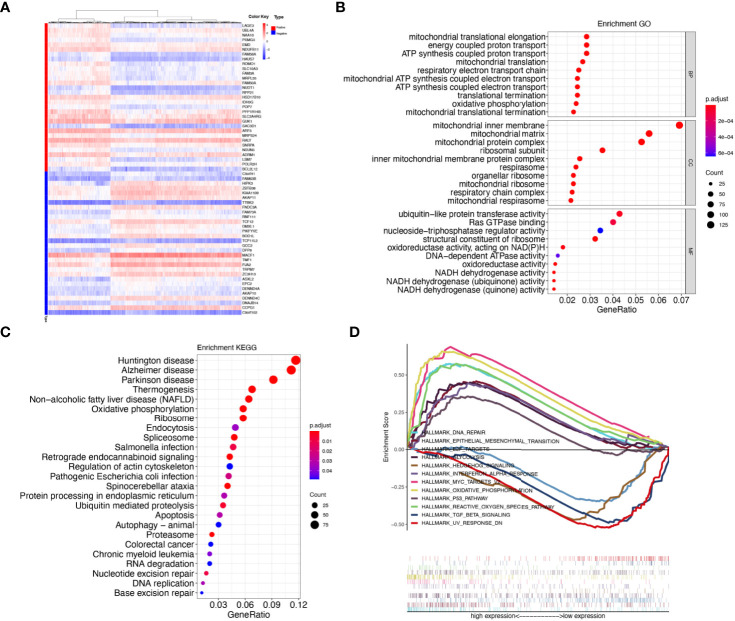
Figure 6.
LAGE3 co-expressed genes and functional enrichment analysis. (A) Heatmaps showing the top 30 genes positively and negatively correlated with LAGE3. (B) GO enrichment analysis (top 10 terms of each subtype) and (C) KEGG enrichment analysis based on genes co-expressed with LAGE3. (D) GSEA analyses displayed key pathways associated with LAGE3 expression.

