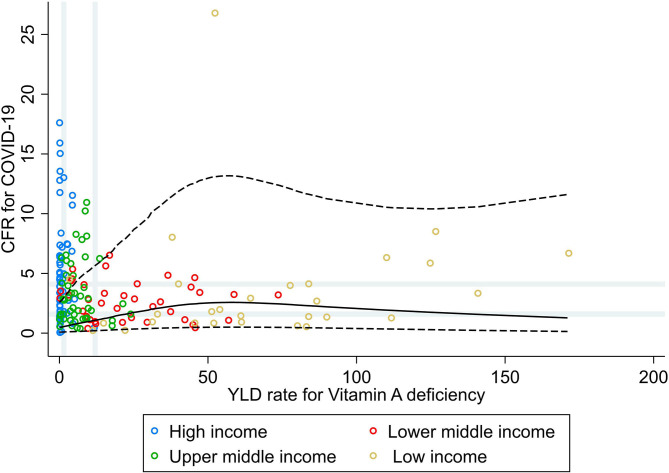
Figure 3.
Scatterplot of years lived with disability rate for vitamin A deficiencies against the average case fatality ratio for COVID-19 at week 10 following the first confirmed death reported, stratified by income group (27). All rates described are crude rates per 100,000 population. Gray vertical and horizontal gridlines indicate tertiles dividing lines for the measures: years lived with disability (YLD) rates for vitamin A deficiency (at 1.5 and 12) and case fatality ratio (CFR) for COVID-19 (at 1.6 and 4.1). Solid black line represents the restricted cubic spline, showing the shape of the adjusted association on a continuous scale with knots at the 5th, 35th, 65th, and 95th percentiles (corresponding YLD rate for vitamin A deficiency of 0.1, 2.3, 10.7, and 84, respectively), with black dashed lines indicating the 95% confidence intervals.

