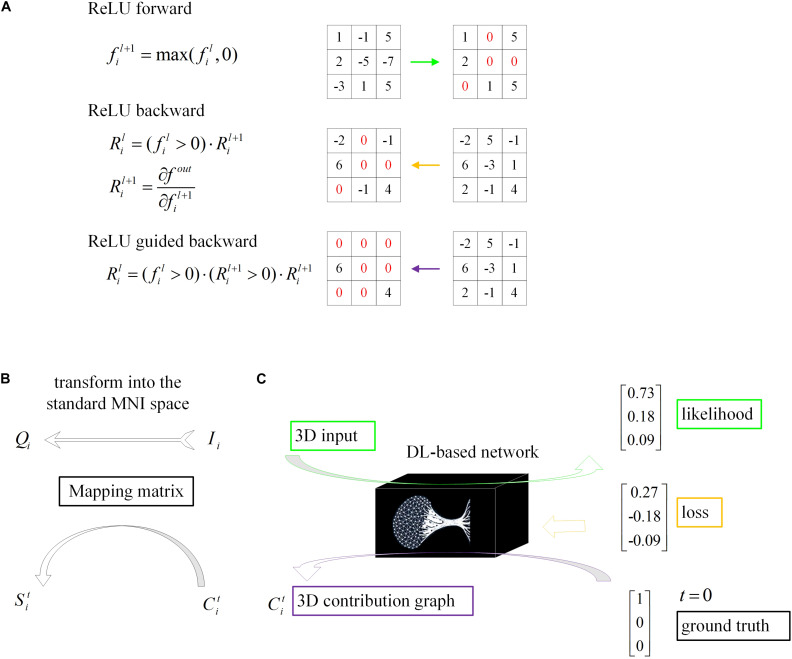
FIGURE 4.
Schematic of model visualization. (A) Difference methods of propagation forward and backward through a ReLU nonlinearity layer. (B) The 3D contribution graph was transformed into the standard MNI space according to the corresponding raw structural MRI image. (C) The difference between the guided backpropagation (information flow in purple) in this algorithm and ordinary backpropagation (information flow in yellow).

