
Figure 1:
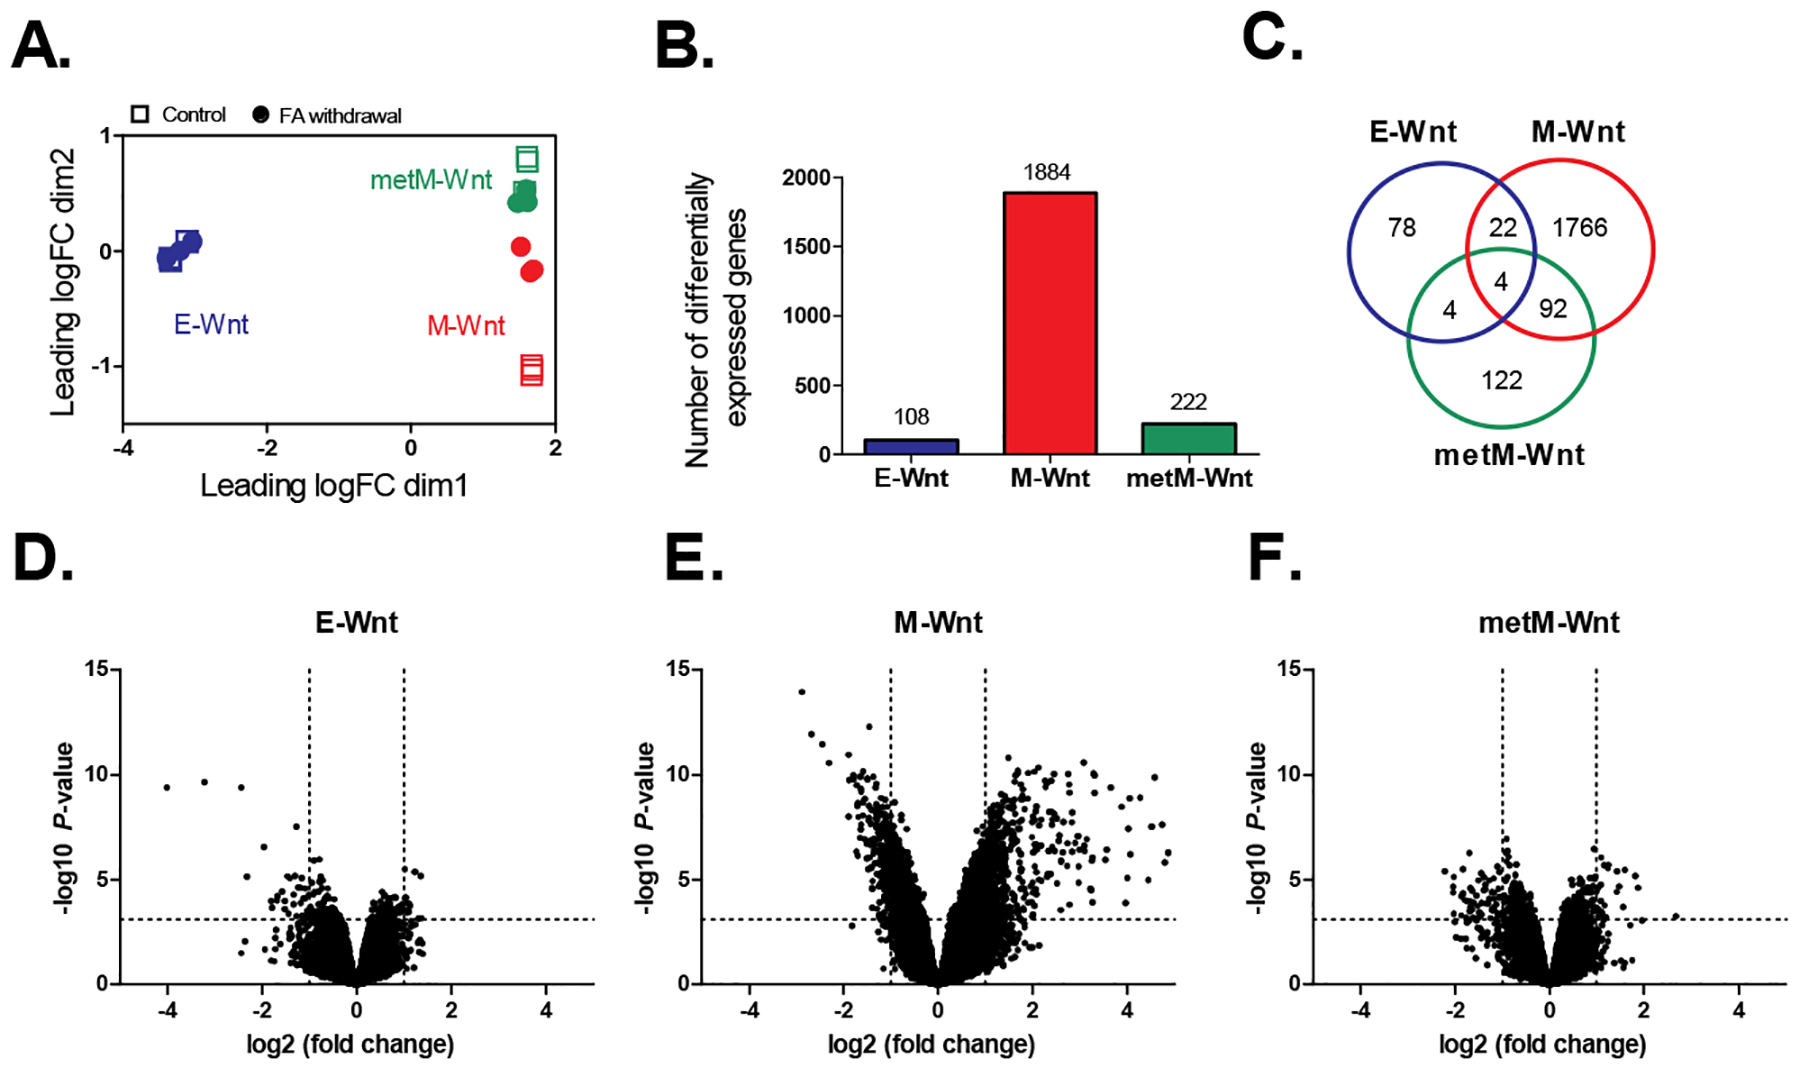
Analysis of transcriptomic data for three mouse TNBC cell lines grown in folic acid-competent (control) or folic acid-free media (withdrawal). A) Multidimensional scaling plot showing the distances between gene expression profiles for the individual samples according to the cellular subtype and treatment based on the top-500 probes. Squares represent control samples (grown in folic acid-competent medium); circles represent samples collected upon folic acid withdrawal. B) Number of differentially expressed genes upon folic acid withdrawal relative to control. BH-adjusted P-values < 0.05. C) Venn diagram showing the overlap between the differentially expressed genes identified for the different subtypes. D-F) Volcano plots showing the (-log10) P-values versus the differences (log2 fold change) in gene expression upon folic acid withdrawal in E-Wnt, M-Wnt and metM-Wntliver cells, respectively. Dashed lines represent the BH-adjusted P-value of 0.05 (horizontal) and fold changes of −2 / 2 (vertical). n=3 biological replicates per group. FA; folic acid.