
Figure 2:
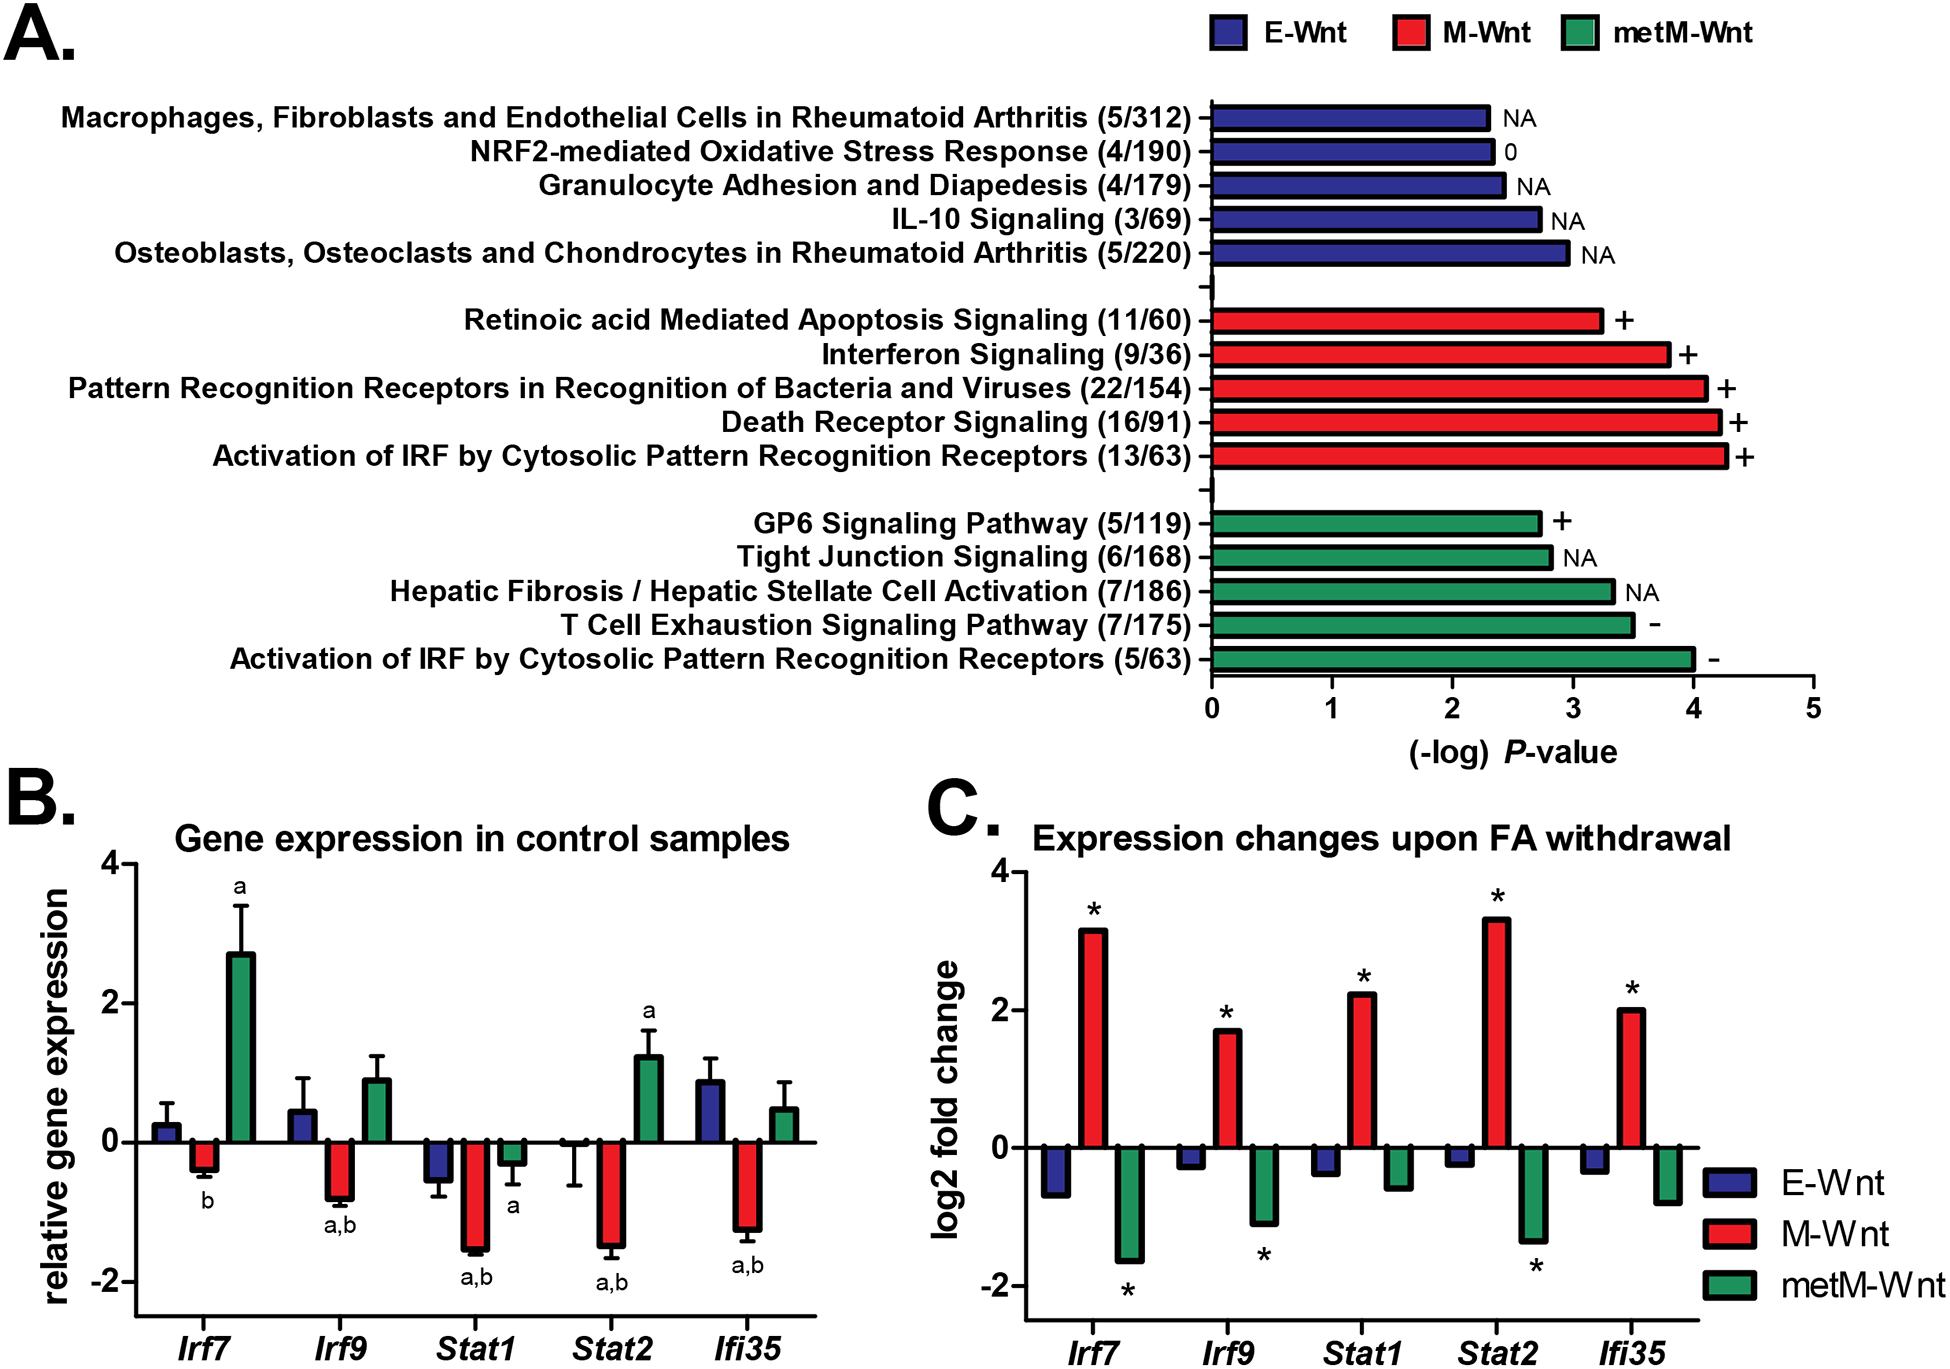
Pathway analyses. A) The top-5 canonical pathways (identified through Ingenuity Pathway Analysis) that were differentially regulated upon folic acid withdrawal in the E-Wnt, M-Wnt or metM-Wntliver cells. The number of differentially expressed genes / the total number of genes in the pathway are shown. A P-value <0.001 was applied as threshold for differential expression. The predicted activation state of the pathways is reflected by + (activation, positive z-score), − (inactivation, negative z-score), 0 (z-score = 0), or NA (activity pattern cannot be assessed). B) Gene expression (mean ± SD) in the control condition (folic acid-competent medium) relative to the common reference NIH3T3 cells according to the microarray data. In case of multiple probes on the array the expression values were averaged. a = BH-adjusted P<0.05 compared to E-Wnt; b = BH-adjusted P<0.05 compared to metM-Wntliver. C) Log2 fold changes in gene expression upon withdrawal of folic acid from the medium (withdrawal versus control conditions). *BH-adjusted P-value <0.05 for comparison folic acid withdrawal versus control condition. Irf7 and Irf9 interferon regulatory factors; Stat1 and Stat2 signal transducer and activator of transcription; Ifi35 interferon-induced protein 35.