
Figure 3:
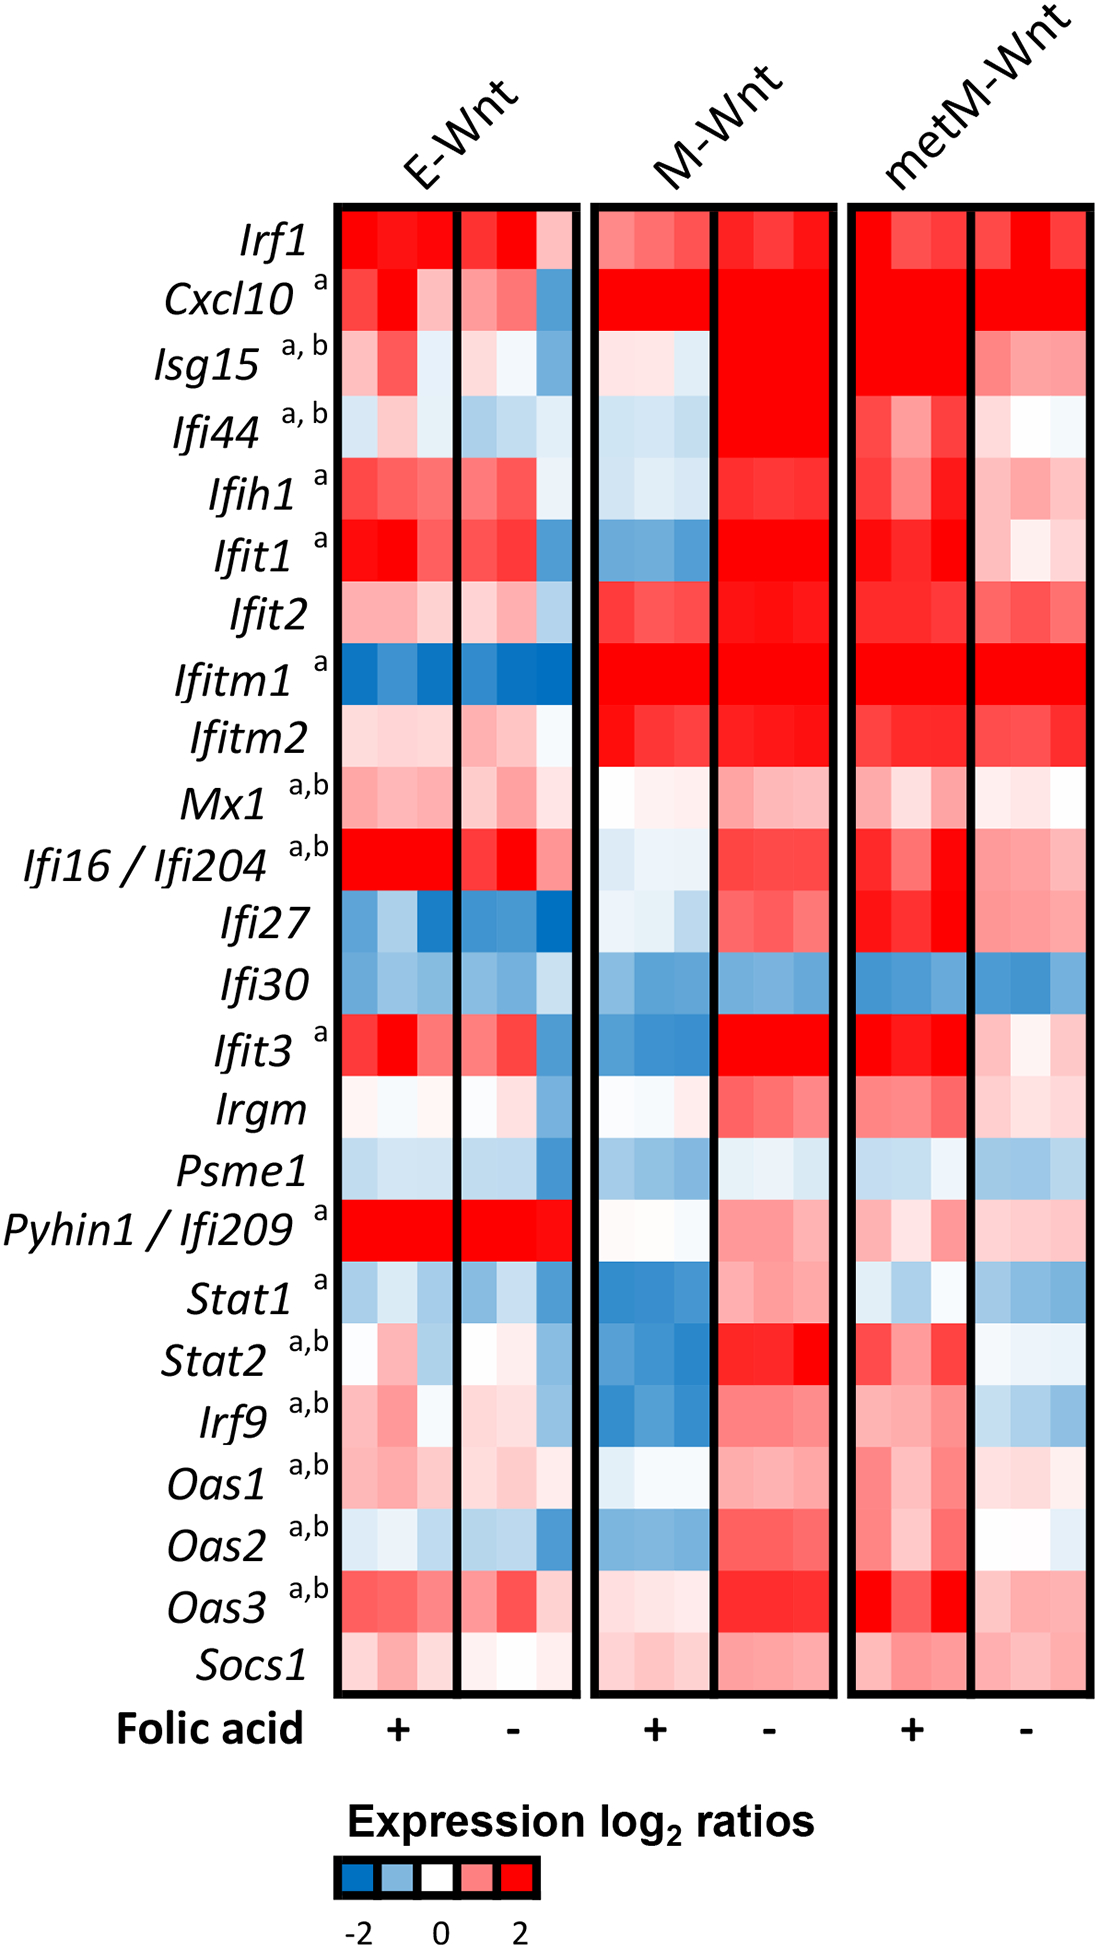
Expression profiles of interferon-responsive genes. Heatmap shows the expression (relative to the common reference NIH3T3 cells) of interferon-responsive genes upon control conditions (+) or folic acid withdrawal (−). A previously reported set of interferon-responsive genes was considered [59]. Colors indicate the expression log2 ratios ranging from blue (−2, low expression) to red (2, high expression) in the current experiment. In case of multiple probes per gene, the average expression value was taken. a Indicates that the expression change upon folic acid withdrawal in M-Wnt cells was statistically significant, b indicates that the expression change upon folic acid withdrawal in metM-Wntliver cells was statistically significant (both BH-adjusted P-value <0.05).