
Figure 4:
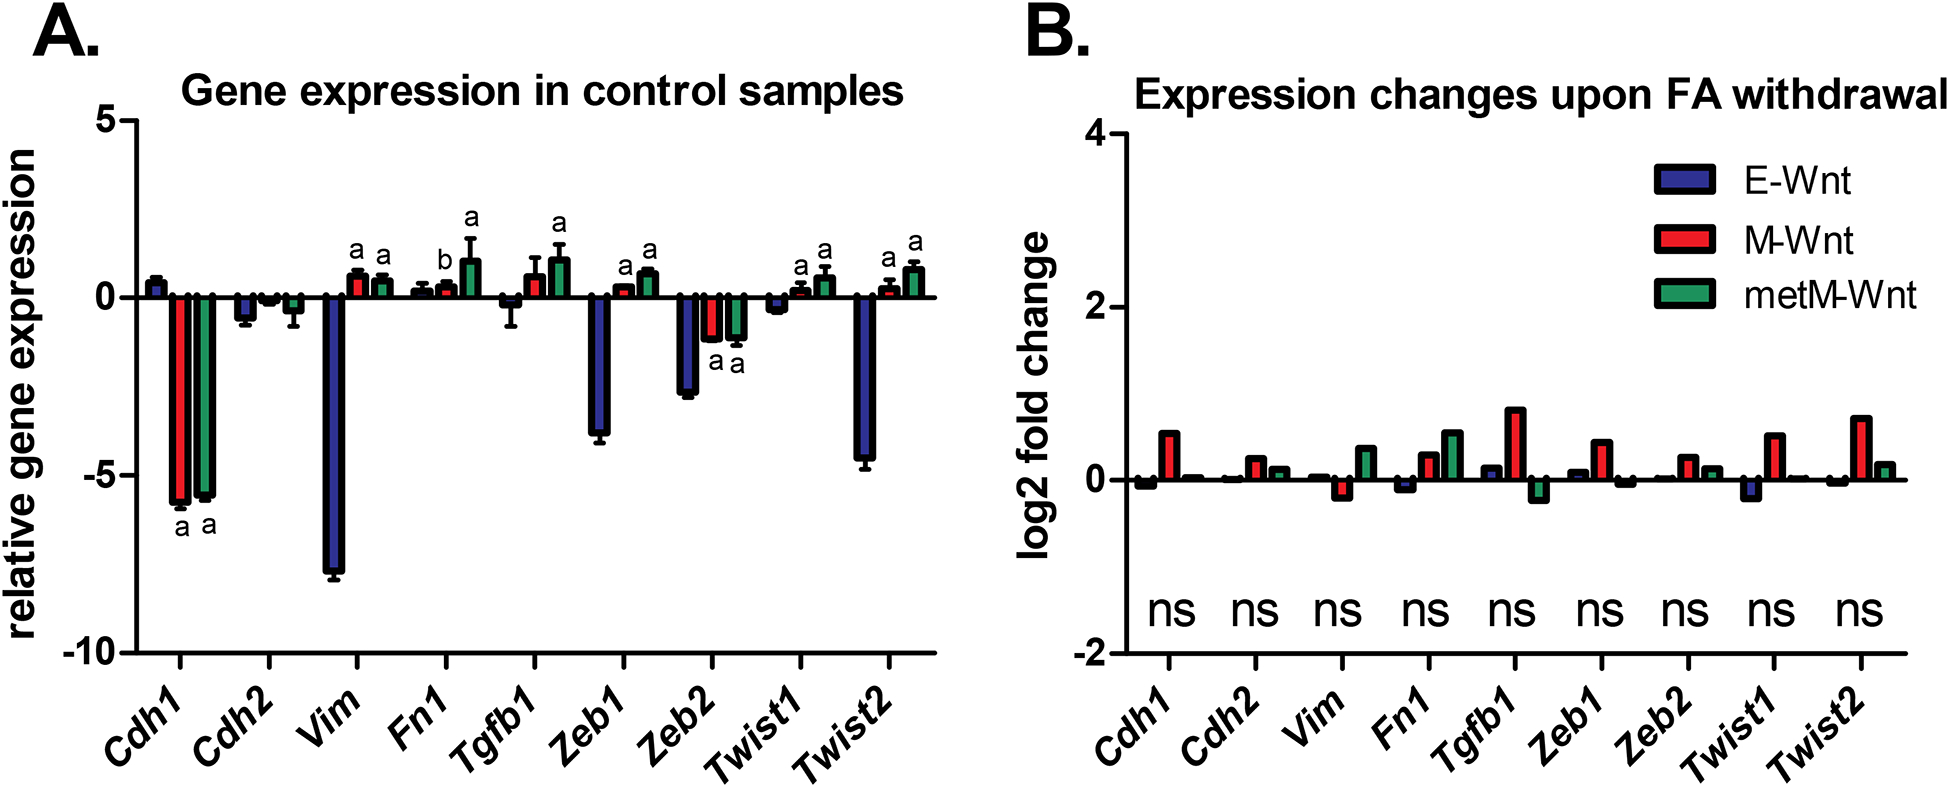
Expression of EMT-related genes in E-Wnt, M-Wnt and metM-Wntliver cells. A) Gene expression (mean ± SD) in the control condition (folic acid-competent medium) relative to the common reference (NIH3T3 cells) according to the microarray data. In case of multiple probes on the array the expression values were averaged. a = BH-adjusted P<0.05 compared to E-Wnt; b = BH-adjusted P<0.05 compared to metM-Wntliver. B) Log2 fold changes in gene expression upon withdrawal of folic acid from the medium (withdrawal versus control conditions; n=3 biological replicates per cellular subtype). Cdh1 E-cadherin; Cdh2 N-cadherin; Vim Vimentin; Fn1 Fibronectin; Tgfb1 transforming growth factor beta 1; Zeb1 and Zeb2 zinc-finger E-box-binding homeobox factors; Twist1 and Twist2 twist family bHLH transcription factors; ns not significant when comparing folic acid withdrawal versus control conditions.