
Figure 5:
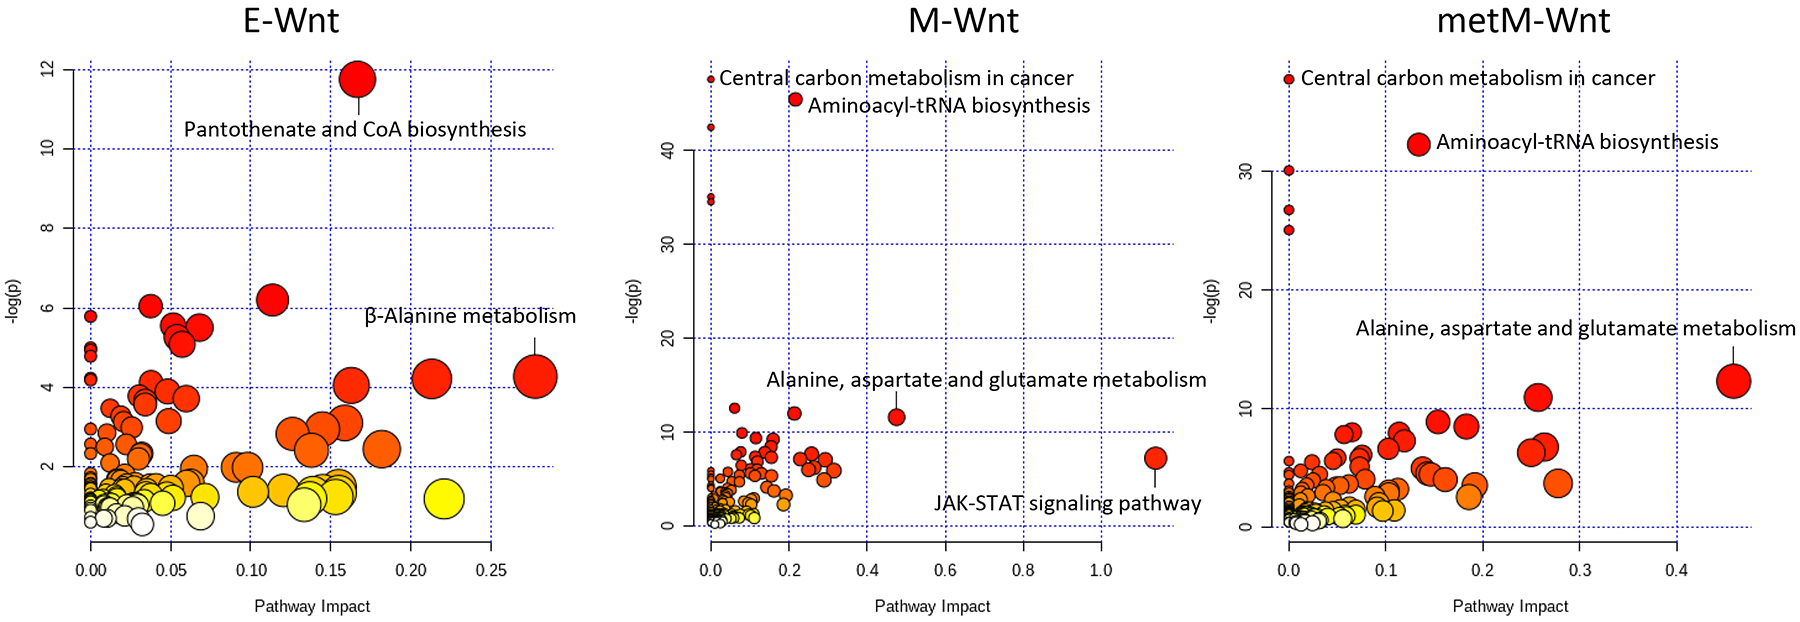
Integrative pathway analyses for transcriptomic and metabolite data using MetaboAnalyst [58]. The top 100 probes showing most pronounced effects of folic acid withdrawal (based on lowest P-values) were analyzed together with the metabolites that were previously reported to be affected by folic acid withdrawal in the E-Wnt (n=12), M-Wnt (n=29) or metM-Wntliver (n=25) cells. Node colors represent -log (ln) P-values for hypergeometric testing as presented on the Y-axis, whereas the X-axis reflects the impact values (with corresponding node sizes) from pathway topology analyses. To clearly illustrate identified pathways for each of the cellular subtypes, scales of the different panels vary.