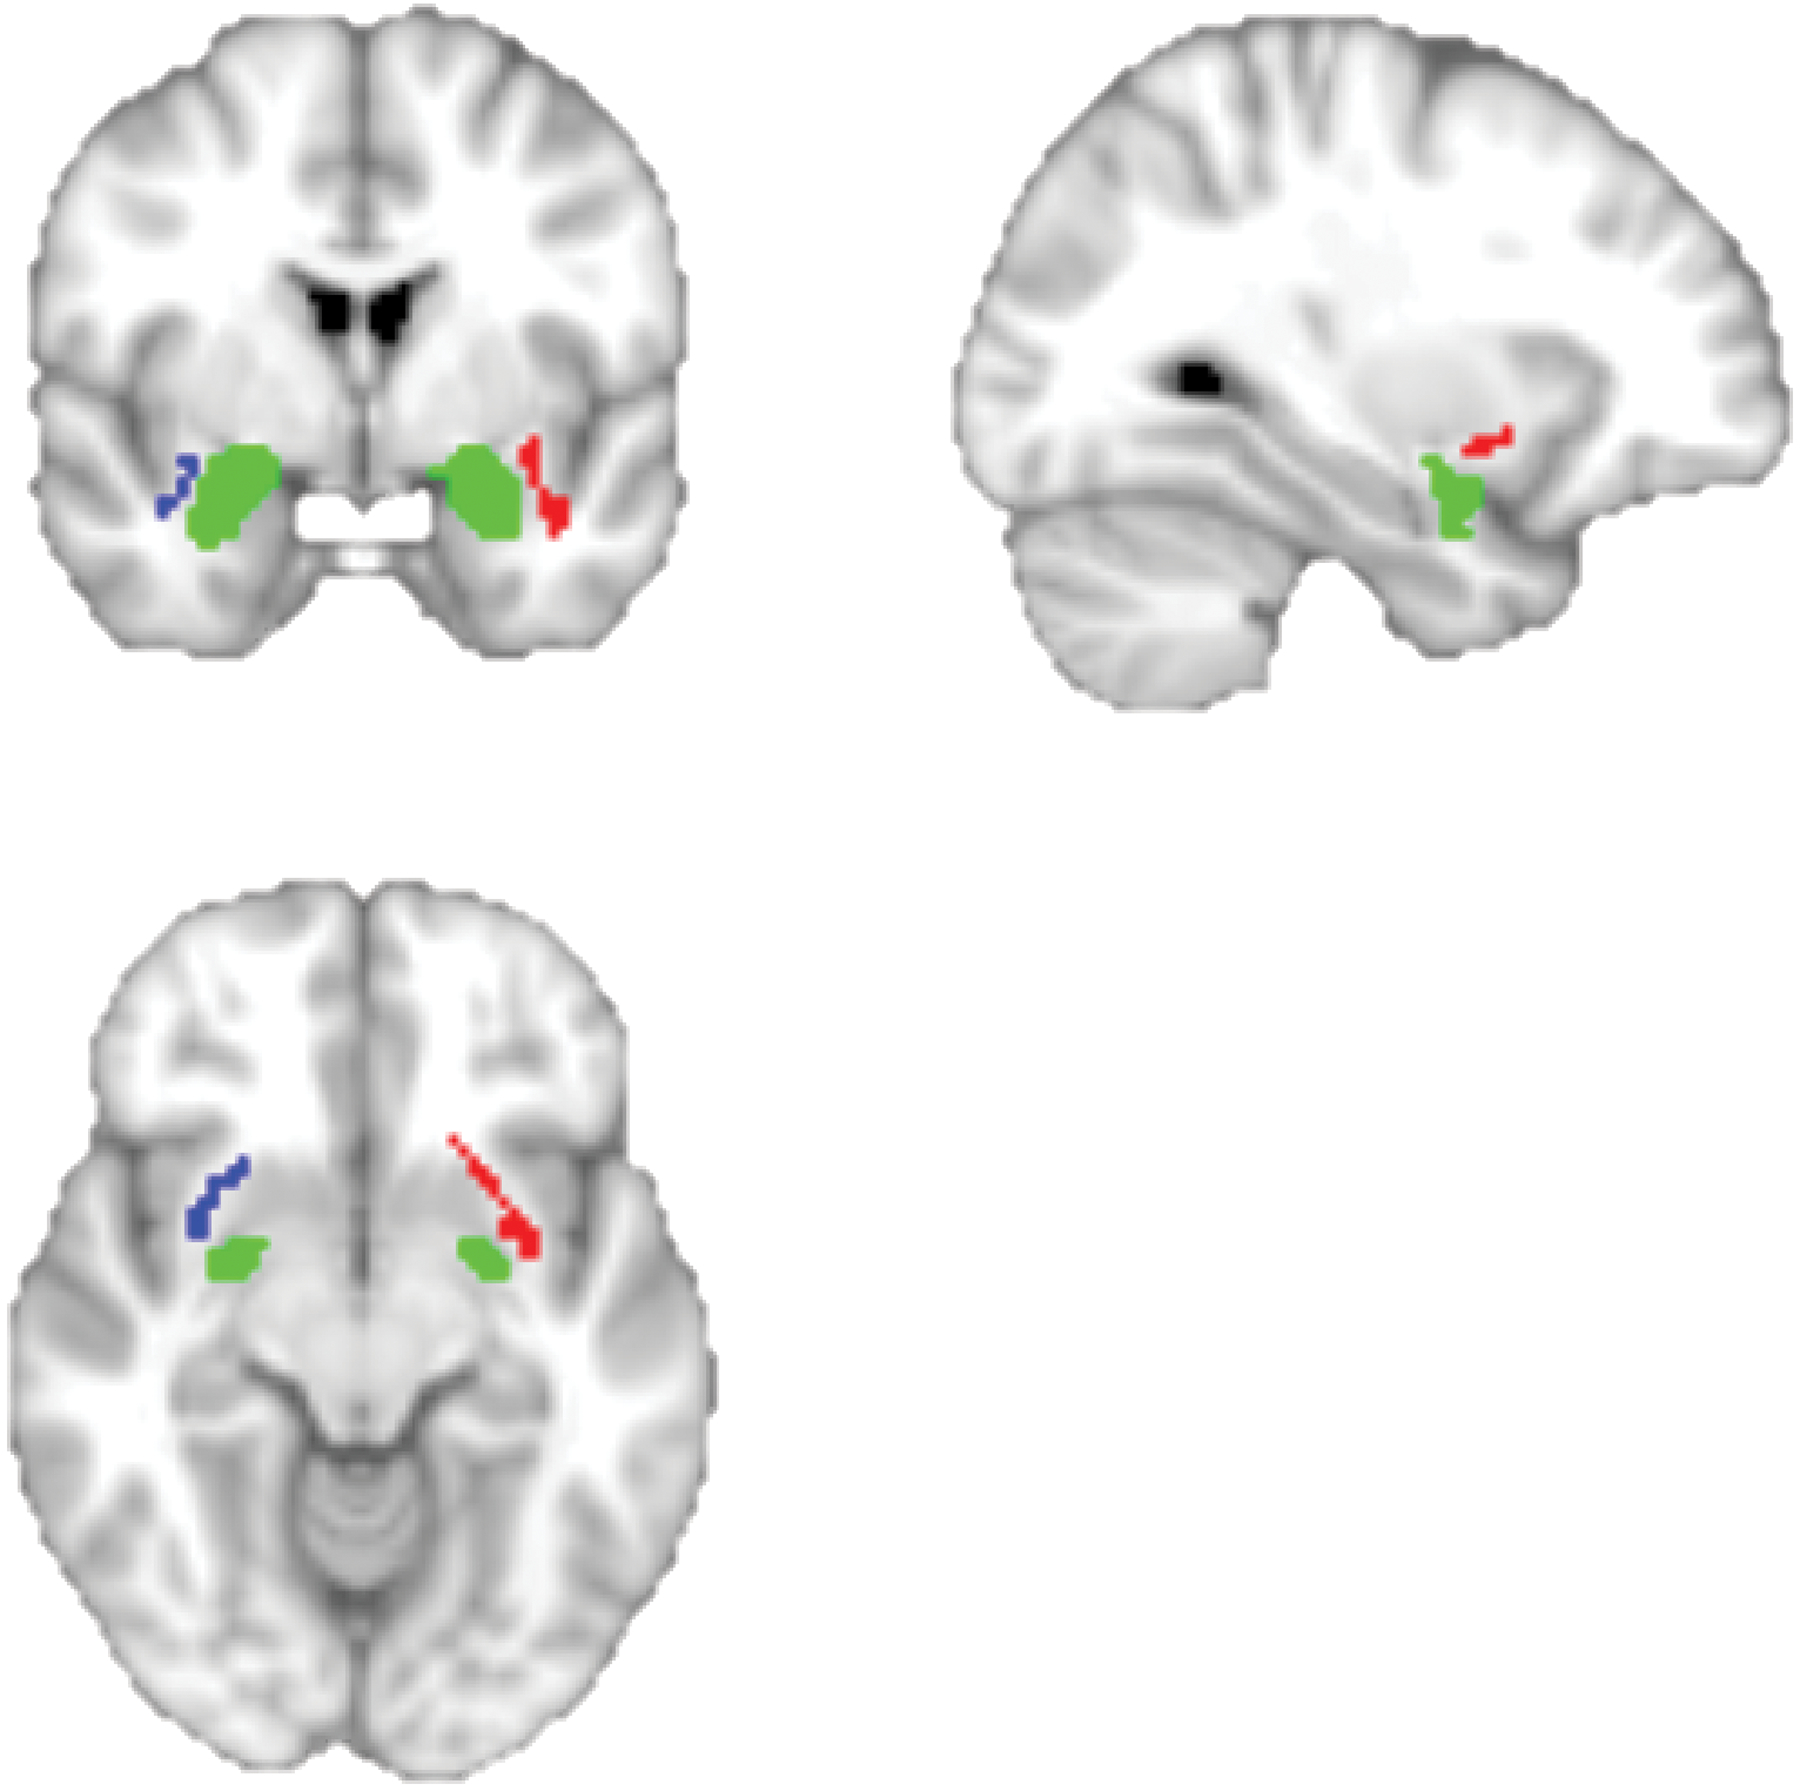
Figure 4.

Representative images of the uncinate fasciculus and amygdala overlaid on the MNI152 T1 image are presented for visualization purposes. The amygdala is displayed in green and the uncinate fasciculus is displayed in red and blue. Note that although we extracted amygdala volume in local subject space, we show the amygdala in MNI space for visualization purposes.
