
Fig. 1.
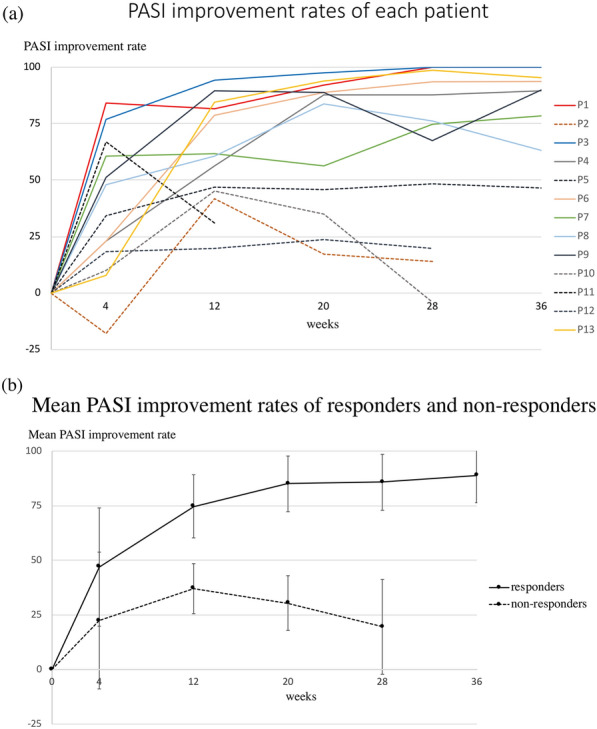
a PASI improvement rates of each patient during guselkumab treatment. Different color lines represent the PASI response of different patients. Solid lines represent those patients who had PASI 50 response at week 12. Dotted lines represent those patients who did not have PASI 50 response at week 12. Two patients had PASI 100 response at week 28 and week 36. One of the nonresponders discontinued guselkumab treatment because of unsatisfactory efficacy. b Mean PASI improvement of PASI 50 responders and nonresponders at week 12 during guselkumab treatment. For PASI 50 responders at week 12, the mean ± SD PASI improvement at week 4, 12, 20, 28, and 36 was 46.9 ± 27.1%, 74.7 ± 14.5%, 85.0 ± 12.7%, 85.7 ± 12.8%, and 88.8 ± 12.5%, respectively. For PASI 50 nonresponders at week 12, mean ± SD PASI improvement at weeks 4, 12, 20, and 28 was 22.4 ± 31.3%, 37.0 ± 11.5%, 30.5 ± 12.5%, and 19.5 ± 21.7%, respectively. PASI, Patient Area and Severity Index; Patient, P