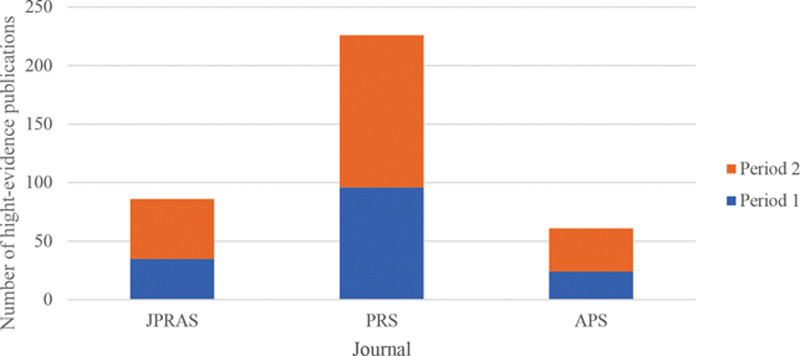
Fig. 6.

Chart showing an amalgamation of the total number of high-level-evidence publications in each of the 3 specialty journals at both time periods. Period 1 = 15/05/2009 to 15/05/2014; period 2 = 16/05/2014 to 16/05/2019. “High-Evidence Publications” refers to an amalgamate of meta-analyses, meta-analyses of RCTs, and RCTs. This chart illustrates an overview of the total number of such publications respective to each journal over the 10-year period from 15/05/2009 to 16/05/2019.
