Figure 4.
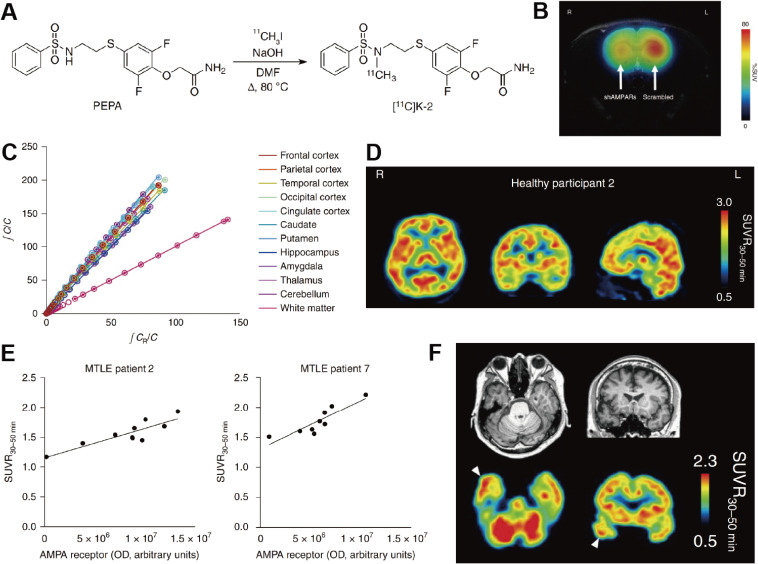
The preclinical and clinical characteristics of [11C]K-2. (A) [11C]K-2 is synthesized by addition of 11CH3I to the sulfonamide of PEPA. (B) Summation image of [11C]K-2 over the 20–40 min after [11C]K-2 injection in an shRNA-injected rat showing that [11C]K-2 decreased in right striatum (shRNA targeted to AMPAR injected side) compared with left striatum (scrambled construct injected side). (C) LGA plot showing the ratio between the integrated tissue TAC in the reference region (white matter; CR) and a tissue TAC (C) (x axis) plotted against the ratio of integrated C with C itself (y axis). A representative LGA plot is presented. The gradient was computed between 36 and 116 min after administration of the radiotracer. This result presents a good linear relationship observed in the graphical plots, indicating reversible binding kinetics for [11C]K-2. (D) Representative orthogonal parametric PET images of averaged standardized uptake value ratio (SUVR) using white matter as a reference during 30–50 min (SUVR30–50 min) after [11C]K-2 injection. (E) Correlations between SUVR30–50 min for [11C]K-2 and the biochemical protein amount of AMPARs (OD) in multiple brain regions from patient 2 (left) and patient 7 (right) with mesial temporal lobe epilepsy (MTLE). These results exhibit a prominent strong significant positive correlation between the protein amount of AMPAR and SUVR30–50 min, demonstrating that SUVR30–50 min (with white matter as a reference region) reflects the regional abundance of AMPARs. (F) SUVR30–50 min images of [11C]K-2 and corresponding MRI images were obtained from a patient with MTLE. White arrowheads indicate the epileptogenic focus. This derives from Ref. 147.

