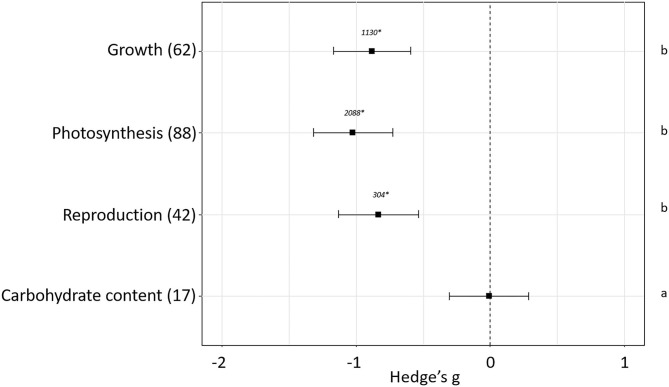
Figure 2.
Effect sizes on general parameters related to fitness. Sample sizes are provided in brackets. Symbols specify mean values of Hedge's g with their 95%CI. Negative values indicate a higher negative effect in fitness on attacked plants than control plants. Different letters indicate significant differences between subgroups (p-value < 0.05). Statistical analysis were performed using Kruskal Wallis tests for non-normally distributed data followed by post-hoc Dunn's tests. Rosenberg's fail-safe numbers are reported in italics. An asterisk indicates a significant fail-safe number.

