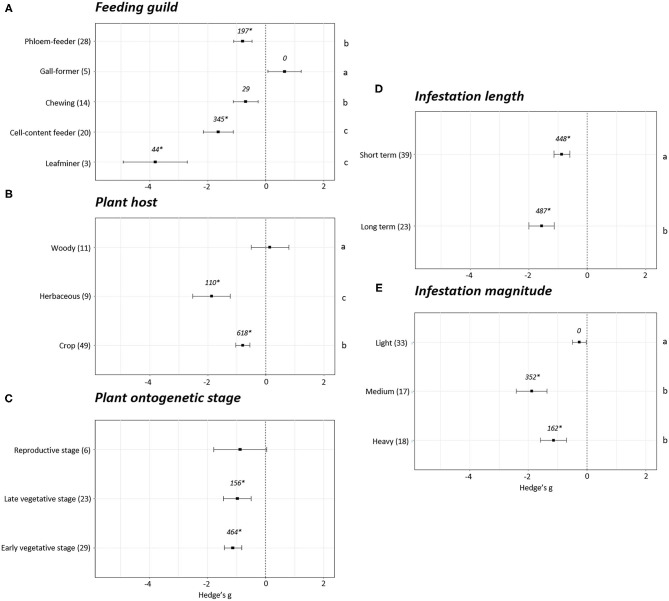
Figure 4.
Photosynthesis effect sizes classified by subgroups. Fitness was analyzed based in different parameters related to photosynthesis. Subgroups included feeding guild (A), type of plant host (B), plant ontogenetic stage (C), infestation length (D) and magnitude of infestation (E). Sample sizes are provided in brackets. Symbols specify mean values of Hedge's g with their 95%CI. Negative values indicate a higher negative effect in fitness on attacked plants than control plants. Different letters indicate significant differences between subgroups (p-value < 0.05). When comparing two groups, statistical analyses were performed using the non-parametric Mann-Whitney U-test. If more than two groups were compared, statistical analysis were performed using One-way ANOVA for normally distributed data followed by Bonferroni test, and Kruskal Wallis tests for non-normally distributed data followed by post-hoc Dunn's tests. Rosenberg's fail-safe numbers are reported in italics. An asterisk indicates a significant fail-safe number.

