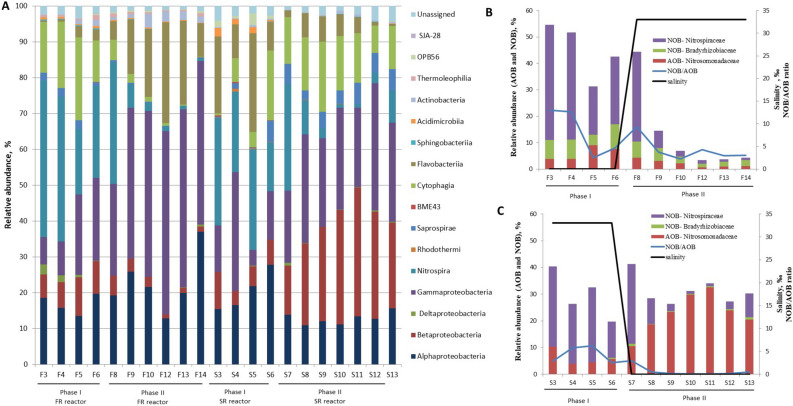
Figure 2.
(A) Relative abundance per sample of the different classes in the samples. For freshwater reactor (FR), F3–F14 samples in phase I and II with freshwater and seawater environment, respectively. For seawater reactor (SR), S3–S13 samples in phase I and II with seawater and freshwater environment, respectively. (B,C) Average relative abundances at family level of the AOB and NOB guilds, the NOB/AOB ratio and the salinity for FR reactor (B) and SR reactor (C).

