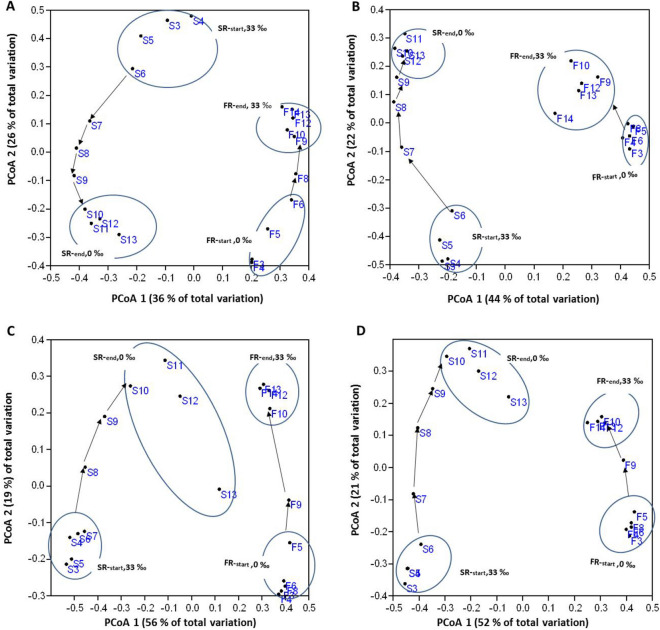
Figure 3.
Principal coordinates analysis (PCoA) based on Bray–Curtis similarity of pyrosequencing data. F4–F14: samples from the freshwater reactor (FR); S3–S13: samples from seawater reactor (SR). (A) Based on total OTUs; (B) Based only on OTUs representing the AOB guild; (C) Based on OTUs representing the NOB guild, and (D) Based on OTUs representing the nitrifying community (AOB plus NOB guilds). Four groups of samples are identified FRstart, FRend, SRstart, and SRend. The arrows between each group show the time line for sampling.

